Follow the big trend, but expect small cycles along the way. Our May 2022 sell signal, 3Q23 buy signal and May 2025 final sell signal are all still on the blog.
Core claim
This page tracks one question: is the money going into AI compute coming back out, and will the hyperscalers pause capex next year?
Compute keeps getting tighter. By mid-2027, annualized revenue per chip reaches the breakeven line.
Money is not the problem in 2027. 2028 is the test: has AI earned the money back?
Sort into layers first, then draw conclusions. AI is already a big market. Pricing, debt, software and users are all splitting into layers, and no single story fits the whole.
The layer table: the same thing looks different from the top layer and the bottom layer
Layer
What the top (frontier) sees
What the bottom sees
What the market misreads it as
Article
Pricing
Frontier models cost more, and volume holds after price increases
Last year's intelligence heads toward zero, with price cuts all the way down
The top 1% have all the usage they need and do things that were not possible before
Capped by usage limits, and see only the cost
「Capex won't pay back」
This table is how to read the five stations: every check starts with the question, which layer am I looking at?
Money flows downstream →
We are here
1DemandDone
Real customers are paying
Already happening, and each quarter adds more than the one before
$141B
Annualized revenue of five AI companies (3Q26)
Next checkpointEnd of 2026: market-wide AI ARR ≈ $138B (base-case path)
AnthropicOpenAI
Latest from the companiesOpenAI launched Astra on Sept. 3, aimed at a clearly different customer base than Fable 5.1
2Supply and spendingIn progress
Each chip earns more (supply can't keep up)
In progress and heading the right way; crosses the breakeven line in mid-2027
$4,040
Annualized revenue per H100e (3Q26), up 206% in three quarters and up 65% in the latest quarter
Next checkpointBreakeven line: $4.5k (mid-2027) / $5.6k (mid-2028)
actualBreakeven $4.5k
Latest from the companiesGoogle, Sept. 8: AI servers pay back in under two years. Alibaba: the compute shortage lasts until at least 2030
3Supply and spendingIn progress
Cloud revenue catches up
In progress, still below the hurdle rate
48%
Cloud revenue growth, YoY (2Q26); Google Cloud +82%
Next checkpoint2027 hurdle rate for cloud growth ≈ 53–55%
GCP YoYDepreciation YoY (projected = hurdle rate)
Latest from the companiesAWS 2Q26 earnings call: servers pay back in under three years and last five to six
4FinancingNot yet
Operating cash flow keeps up with spending
Not yet; the test comes in 2027 to 2028
+40% / +40%
2027 growth in operating cash flow vs. capex for the five hyperscalers: about even
Next checkpointEnd of 2027: operating cash flow has to grow faster than capex
MSFTGOOGAMZNMETACapex = operating cash flow
Latest from the companiesGoogle in August: two bond deals a year from now on. Amazon went to the sterling market in September
5FinancingNot yet
Free cash flow turns positive
The final confirmation, due in 2028
2028
The quarter when 'borrowing to invest' turns into 'printing money'
Next checkpoint2028
MSFTGOOGAMZNMETAFCF = 0
Latest from the companiesAlphabet 1Q26 buybacks $0, Meta 4Q25 $0: buybacks effectively on hold
Station ① checks: if the claim is right, what we should see
Original callOn Jul 17, 2026 we said: market-wide AI annualized revenue would reach about $150B by the end of 2026 (then: about $73B in Q2 2026). The call: $150B by end-2026 → now: 2Q26 $74B → 3Q26 $141B, up $67B in one quarter
Original callOn Jul 17, 2026 we said: market-wide AI annualized revenue would reach about $150B by the end of 2026 (then: about $73B in Q2 2026). The call: $150B by end-2026 → now: 2Q26 $74B → 3Q26 $141B, up $67B in one quarter
Positive caseEach quarterly increase is bigger than the last
Negative caseA quarter where ARR shrinks (OpenAI in 2Q26 is the only case so far)
Positive caseThe new product line's share rises month after month and total spending grows
Negative caseFable 5 share fails to rise for three straight months and total spending slows (warning light)
Threshold:Share fails to rise for three straight monthsUpdated:Monthly
Charts 1
Model-Layer Spend Mix: Are New Flagships Actually Getting Paid? (Ramp AI Index Model Breakdown)
Articles 0
—
Station ② checks: if the claim is right, what we should see
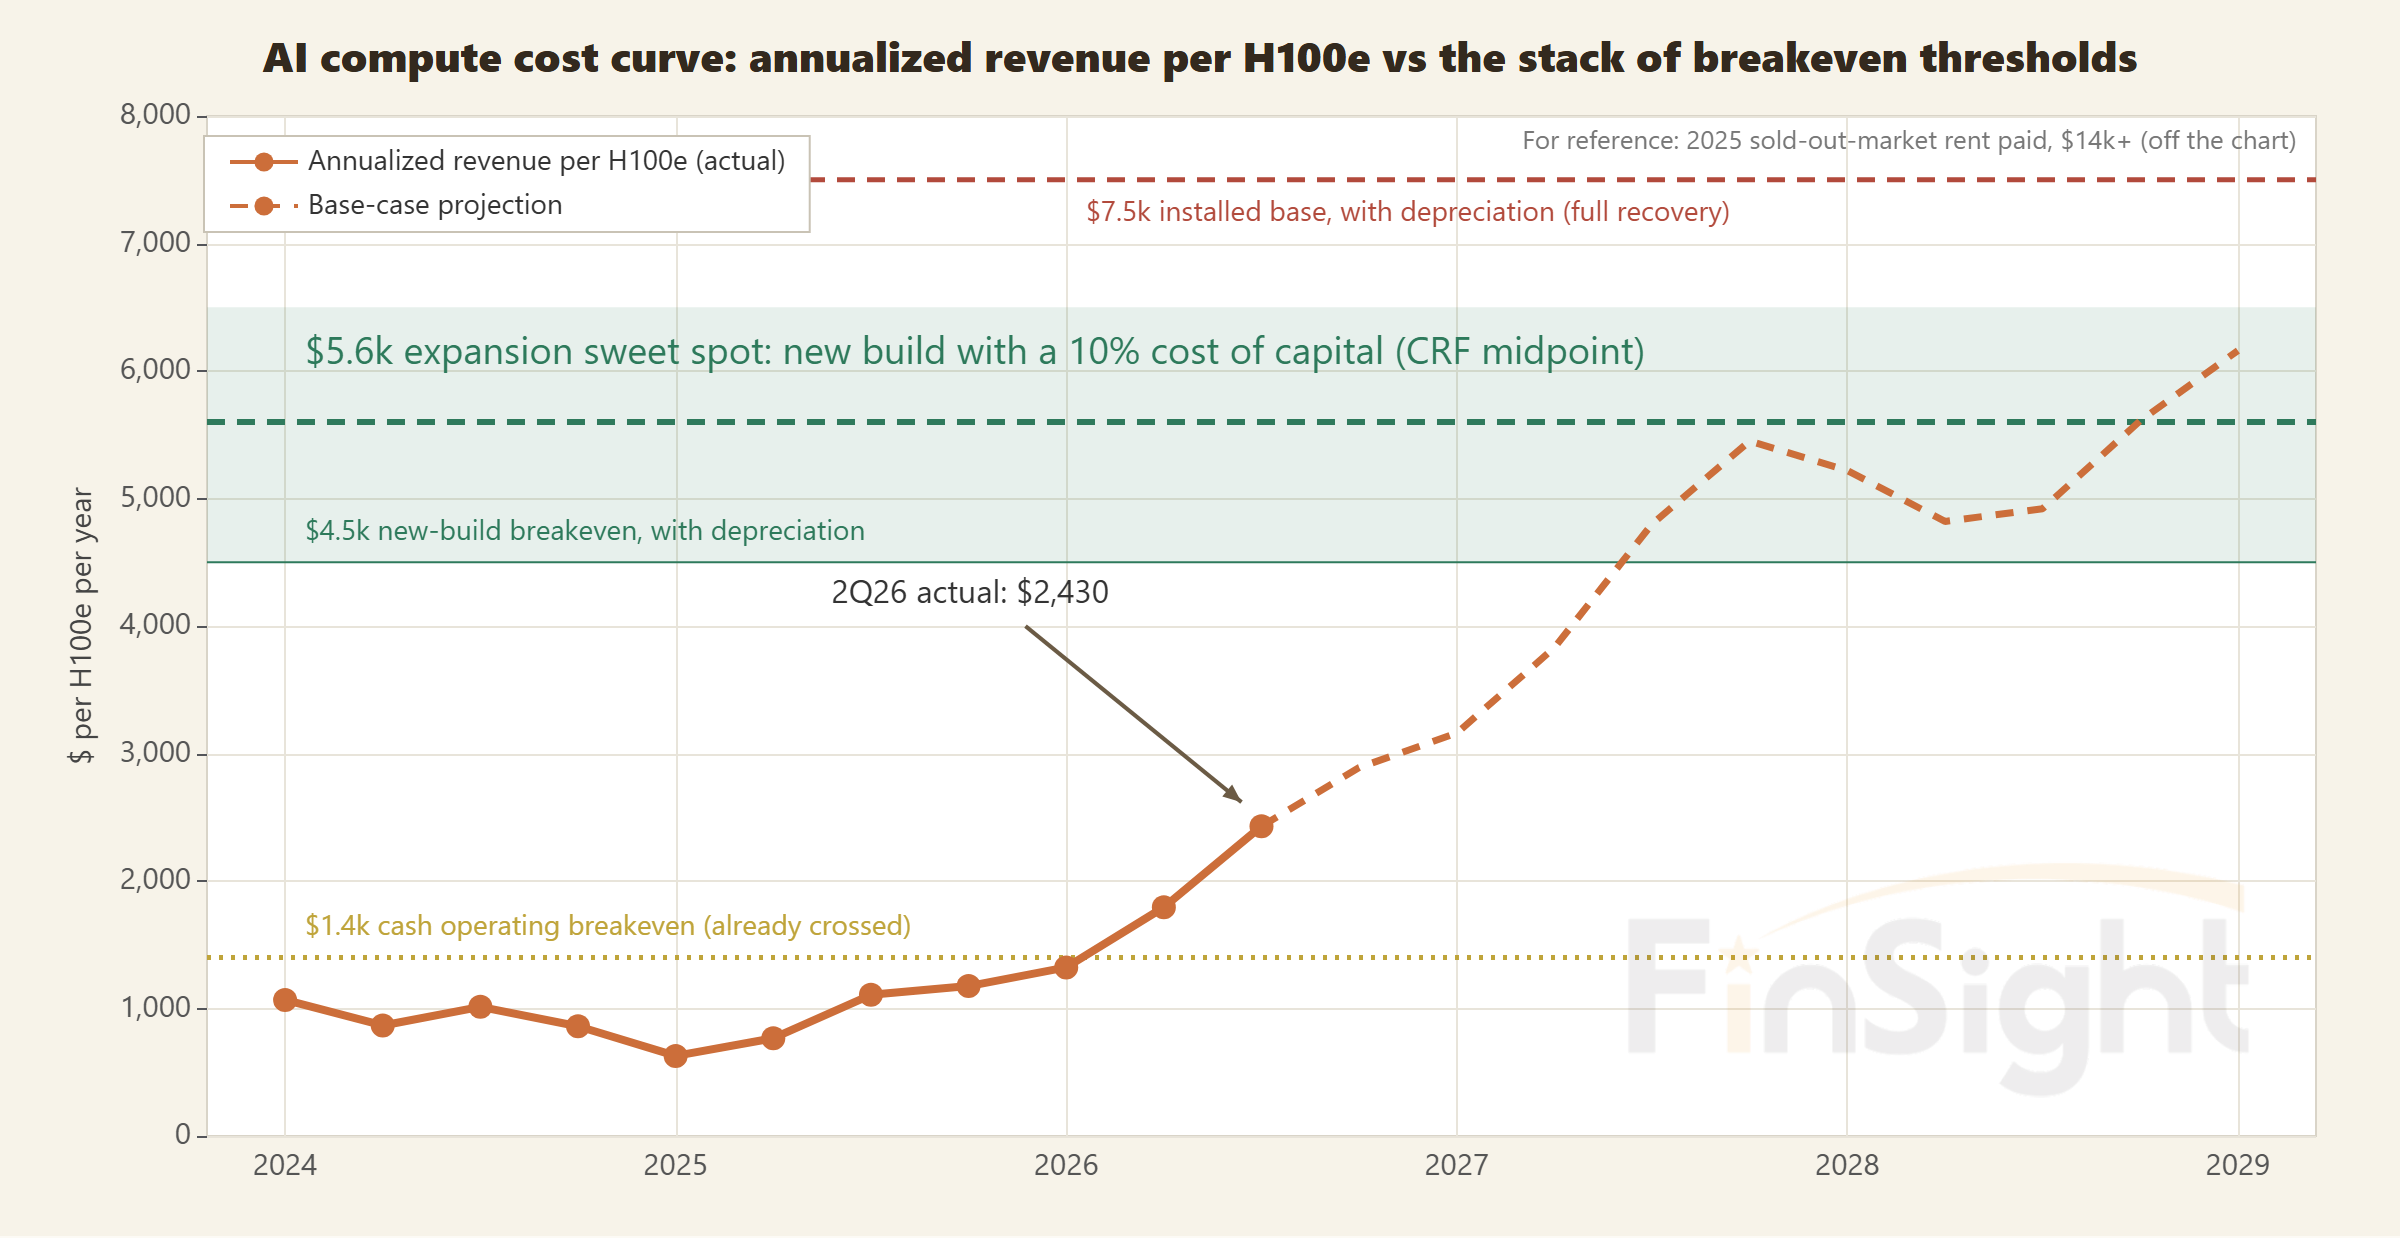
Original callOn Jul 22, 2026 we said: annualized revenue per chip would reach the $4,500 breakeven line by mid-2027 (then: $2,445 in Q2 2026). The call: $4.5k by mid-2027 → now: $1,322 (4Q25) → $2,455 (2Q26) → $4,040 (3Q26); thresholds $4.5k / $5.6k
Original callOn Jul 22, 2026 we said: annualized revenue per chip would reach the $4,500 breakeven line by mid-2027 (then: $2,445 in Q2 2026). The call: $4.5k by mid-2027 → now: $1,322 (4Q25) → $2,455 (2Q26) → $4,040 (3Q26); thresholds $4.5k / $5.6k
Positive caseThe number keeps rising and clears the cost band in mid-2027
Negative caseSupply comes online faster than revenue and the number flattens or turns down
Threshold:$4.5k (mid-2027)Updated:Quarterly
Charts 3
Tightness Gauge: Annualized Revenue per H100e (History Plus Projection)
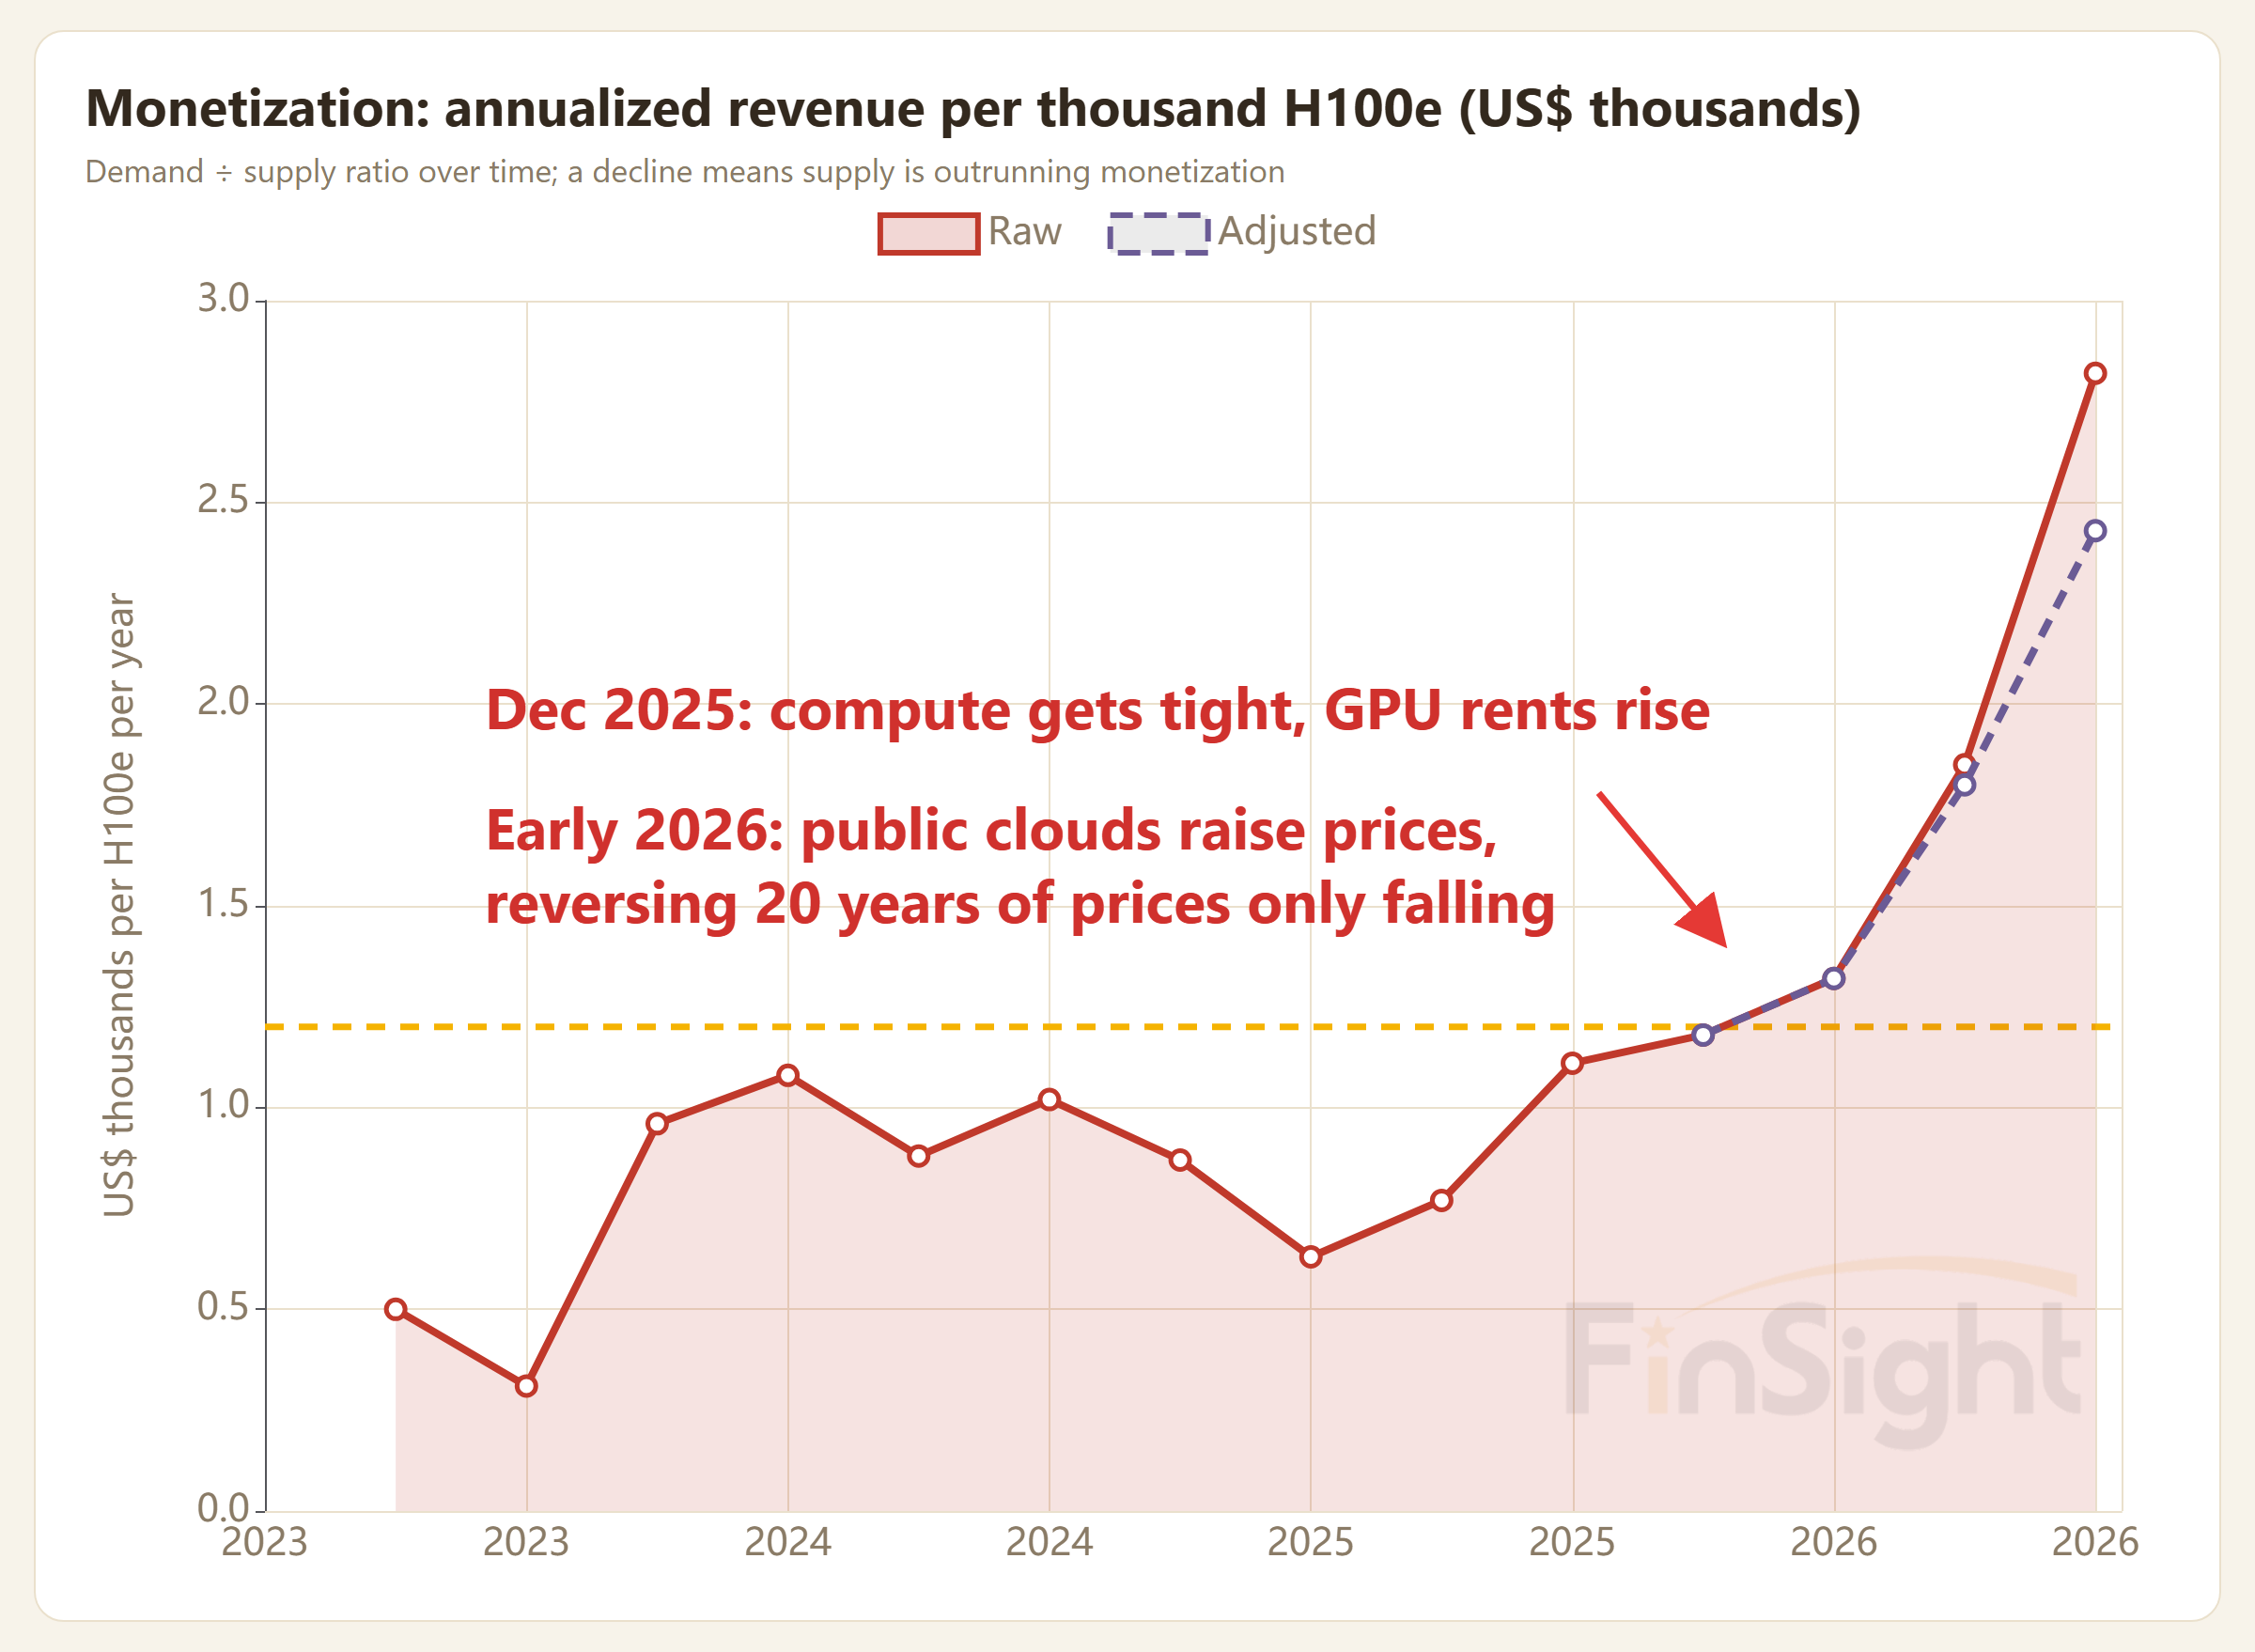
Monetization: Annualized Revenue per Thousand H100e (US$ Thousands)
AI compute cost curve: annualized revenue per H100e against the breakeven thresholds
2026-09-08AMD,Jean Hu(財務長)we do expect the second half, the CPU business is going to expand more than 80% year-over-year and into next year continue to expand more than 70%, which continue to be supply-constrained.
2026-09-08AMD,Jean Hu(財務長)we have three major anchor customers, Meta and OpenAI and Anthropic. All three of them, the deployment are going to be multiple gigawatt scale deployment… all three of them give us the forecast more than what we expected in the beginning
2026-09-08AMD,Jean Hu(財務長)If wafer price increase, you should expect us to increase the CPU price, too… we're not going to increase the price just to expand the gross margin.
2026-09-08CoreWeave,管理層we have over a gigawatt of power contracted outside of the U.S. as you kind of look to build a portfolio of infrastructure to be able to support your clients with.
2026-09-08思科,管理層only like sub-2% of the humans in the world that are probably using agents in any kind of power user capacity… for there to be massive kind of supply shortage… at a macro level on the infrastructure that's needed. So I actually don't see an end in sight as far as the demand
2026-09-08思科,Mark Patterson, EVP & CFOif you look at the last quarter or two, we've actually been able to manage the memory price increases pretty well and been able to pass the cost on to our customers and largely in part because of the demand tailwinds that we talked about.
2026-09-02博通,Hock Tan, President & CEOstarting with the 1 gigawatt of ironwood we are deploying in 2026. We expect Entropic to deploy another 5 gigawatts of TPU V-version 8i in 2027. And in 2028, we have clear line-of-sight to deliver another -- an incremental 10 gigawatts
2026-09-02博通,Hock Tan, President & CEOFor OpenAI, Helpino is on-track for the planned deployment of 1.3 gigawatts in 2027… In 2028, we have line-of-sight for OpenAI to deploy over 5 gigawatts of Jalapeno and its successor generation of XPU, which would make OpenAI our second-largest XPU customer.
2026-09-02博通,Hock Tan, President & CEOBetween now and the end of 2027, we will be delivering three generations of MTIA accelerators to Meta. Across these three generations, we have line- of-sight to deploy 3 gigawatts through '28.
2026-09-02博通,Kirsten Spears, CFOwe established the AI XPV platform in partnership with Apollo and Blackstone to enable more than 20 gigawatts of compute infrastructure for OpenAI and Anthropic by the end of 2028. We closed the first $35 billion tranche in June for Anthropic's 1 gigawatt deployment
2026-09-02博通,Hock Tan, President & CEOit will be 30 gigawatt -- 30 gigawatts between the customers we have, the six customers we have. Question is, will all 30 come into production within these two-year fiscal years? And we are giving you a judged number of $115 billion… fiscal '27, another $230 billion in '28
2026-08-27Marvell,Matt Murphy, Chairman & CEOthis fungibility requirement given the dynamic nature of the market and some of the constraints we're seeing. Some are supply constraints, some are power constraints, some are architectural constraints
2026-08-26NVIDIA,管理層our NeoCloud partners are bringing capacity online faster and at lower token costs, expected to exit the year with 8 gigawatts in total installed capacity, up from approximately 3 gigawatts at the end of 2025.
2026-08-26NVIDIA,管理層The initial deployment, expected to support 4.25 gigawatts of AI factory capacity, will be utilized by OpenAI Each generation of NVIDIA AI factory systems deployed at PORTS-Pike could represent approximately 1.5 million NVIDIA GPUs
2026-08-26NVIDIA,管理層OpenAI has committed to substantially deployments of NVIDIA AI infrastructure through 2030. OpenAI's existing and planned commitments represent approximately 12 gigawatts of NVIDIA compute.
2026-08-26NVIDIA,管理層For another frontier AI lab, we will provide selective credit enhancement for nearly 2 gigawatts of compute.
2026-08-26NVIDIA,管理層we are experiencing extreme pricing conditions in memory. The magnitude of the price increase has exceeded our prior expectations and is headed even higher into next year.
2026-08-20阿里巴巴,Eddie Wu(CEO)There is a consensus across the industry that the current shortage in AI compute will not be resolved until at least 2030. So, industry-wide then it makes sense that there should be high certainty in our investments in AI compute.
2026-08-20阿里巴巴,管理層The strong performance demonstrates growing customer adoption … as well as our enhanced scale efficiencies and the robust pricing power in a supply-constrained market.
2026-08-12Coherent,管理層I'm trying to think if there's any product line we're not supply constrained on. The demand is robust across almost every single product across data center and comms, and it's really just a matter of as fast -- we can sell as fast as we can ramp production.
2026-08-12Nebius,Arkady Volozh(創辦人暨 CEO)We launched our first capacity auction. It was very successful and cleared at the highest price we have seen for the Blackwell generation of chips. 15% above the highest price we ever charged before.
2026-08-11CoreWeave,Nitin Agrawal(CFO)our July pricing changes, which included an approximately 25% increase across SKUs in response to the current demand environment … we recently signed an A100 contract that extends into 2029 at an attractive price. As a reminder, this SKU was introduced in 2020.
2026-08-04AMD,管理層Anthropic will deploy up to 2 gigawatts of MI450 Series GPUs in Helios, with deployment of the first gigawatt beginning in the first half of 2027.
2026-08-04AMD,Lisa Su(董事長暨執行長)the server CPU supply chain is tight right now and it has been tight for the first half of the year because much of this demand was unforecasted. As we get into 2027… we would expect that the 2027 server supply situation should be better than '26.
2026-08-04Arista,管理層Our memory supply has been secured for 2026, and we have extended visibility well into 2027 across DDR4, DDR5, and NAND memory.
2026-08-04SpaceX(xAI),管理層We ended the second quarter with 1.4 gigawatts of nameplate compute, up from 1 gigawatt in Q1 and 400 megawatts a year earlier. We expect to end this year at over 2 gigawatts of compute capacity.
2026-08-04SpaceX(xAI),管理層we expect to end this year with over 2 gigawatts of compute, and probably our cumulative compute online by the end of next year will be several times higher. So, it may, let's say be closer to 10 gigawatts of compute than 5 gigawatts of compute
2026-08-04SpaceX(xAI),Elon Musk(CEO)our tentative target is to actually have 20 gigawatts at the power and cooling level online by the end of next year. Now, I don't think we're going to achieve 20 gigawatts … I would expect that we still probably have at the power plant level, something close to 15 gigawatts.
2026-08-04SpaceX(xAI),管理層as Elon mentioned, we expect the supply- demand imbalance in the compute market to continue.
2026-08-04SpaceX(xAI),管理層The memory output is increasing by around 20% per year … the demand is increasing by 200% a year, maybe higher. So if you've got demand increasing much faster than supply, then Economics 101 would suggest that the price increases. It does not decrease.
2026-07-30三星,管理層it will be unlikely to see any significant increase in incremental supply through 2028. … The supply constraints are expected to become even more severe in 2027 than 2026, reinforcing our view that the supply shortage will persist through 2028. Beyond 2029, it is hard to say
2026-07-29SK海力士,Song Hyun-jong(企業中心總裁)a tight supply environment continued leading to a sustained upward trend in prices. … DRAM and NAND recorded meaningful price increases following the previous quarter with AI-related products such as Server DRAM and Enterprise SSDs driving this growth.
2026-07-29SK海力士,管理層In fact, our major customers are still requesting more memory supply. … On the supply side, however, it appears difficult for the supply-demand balance to improve meaningfully in the near-term.
2026-07-29Meta,Mark Zuckerberg (CEO)we announced a new strategic venture with BlackRock to develop a new 1 gigawatt data center in El Paso, Texas.
2026-07-29Meta,Susan Li (CFO)we believe that overall industry capacity is going to remain tight for the foreseeable future.
2026-07-29微軟,管理層We added 31 new data centers across five continents this quarter, bringing the total to 88 this year… All up, we added another gigawatt of capacity this quarter and remain on track to roughly double our overall capacity in just two years.
2026-07-29微軟,Amy Hood(CFO)currently, the situation is obviously that demand exceeds available supply in a sort of relatively extreme moment… you've seen our CapEx really pivot toward… short-lived assets, which really, right, that's CPUs and GPUs that have relatively shorter lead times.
2026-07-29微軟,Amy Hood(CFO)the cloud still provides a great ROI in those types of situations. And we're adding this capacity to your point. But a lot of this obviously is also being sold in newer contracts and we're able to have the pricing ref lected to keep value
2026-07-22Google,Anat Ashkenazi (CFO)we're still in a supply-constrained environment. I think we've said this now for multiple quarters in a row. … while we have increased our capacity quite significantly over the past three years, the demand still outpaces that investment.
2026-07-22Google,Sundar Pichai (CEO)to the extent that our input costs going up to us, we ref lect that in our ability to price our solutions and see returns there.
2026-07-16台積電,C.C. Wei, Chairman & CEOwe don't suddenly increase our price by which I like to have 4x or 5x. You cannot survive… for your customer to survive for that kind of a price increase. So we earn our value and we make sure that our profit, our gross margin is enough for our long-term sustaining expansion
2026-07-16台積電,C.C. Wei, Chairman & CEOsince our capacity in the back end is so in shortage mode, the gap is bigger. And so I welcome that the competitor offers some of the f lexibility to my customer so that their front-end wafer can be put into the package and that help TSMC's front-end wafer business.
2026-07-16台積電,C.C. Wei, Chairman & CEOOnly the one which related to AI is in shortage. Which is the most important one is number one is power management IC, because of all the AI data center need a lot of power management and those are the mature node technology… Those are in shortage. Definitely.
2026-06-24美光,管理層DRAM and NAND industry demand continues to significantly exceed industry supply. We expect tight conditions to persist beyond calendar 2027 … we have now signed 16 strategic customer agreements
2026-06-10甲骨文,管理層Q4 finalized an impressive FY '26 where we delivered more than 1.2 gigawatts to customers. Our pace of delivery continues to accelerate, with our FY '27 Q1 delivery approaching 1 gigawatt, nearly the same capacity as we've delivered in the previous four quarters combined.
2026-06-04博通,Hock Tan, President & CEOFor Anthropic, as you know, for 2026, we are providing access to Broadcom TPU-based compute of over 1 gigawatts. In April, we entered into an agreement to enable Anthropic … to access another 5 gigawatts of next-generation TPU-based compute beginning in 2027.
2026-06-04博通,Hock Tan, President & CEOFor OpenAI, we have delivered silicon, and we are on track for production late 2026. We have a contractual commitment to deploy 1.3 gigawatts in 2027 as part of the larger 10 gigawatts that by 2029 agreement we announced last year.
2026-06-04博通,Hock Tan, President & CEOunder this agreement, we expect to deploy 3 gigawatts through to the -- through the end of 2028. The initial order for 1 gigawatt… has been received and will start delivery in the second half of 2027… To date, we have received purchase orders totaling $6 billion.
2026-06-04博通,Hock Tan, President & CEOwe are creating the AI XPV platform with Apollo and Blackstone, and other leading investors, to deploy more than 20 gigawatts of compute capacity through 2028. The first tranche of this platform, valued at $35 billion, is in fact currently being launched by Apollo.
2026-06-04博通,Hock Tan, President & CEOfor '27, we indicated about 10 gigawatts shipment in '27. They're still very much intact… we're planning to ship 10 gigawatts in '27 and that nothing has changed. Back half loaded to that extent, yes… So '28, we expect a lot more gigawatts.
2026-06-04博通,Hock Tan, President & CEOthat's what's driving this very large, I call it insatiable growth in compute capacity that we are experiencing and we see that continuing to happen now to the -- through 2027 and what we're seeing now through 2028 as well.
2026-05-27Marvell,管理層enabling Marvell to scale revenue significantly during a period when the broader industry has remained supply constrained. We are forecasting approximately $1 billion in prepayments during this fiscal year with the first payments beginning in the second quarter.
2026-05-20NVIDIA,管理層The price of renting an H100 has risen 20% year-to-date, while A100 cloud pricing is up nearly 15%.
2026-05-20NVIDIA,管理層my sense is that we'll be supply constrained throughout the entire life of Vera Rubin.
2026-05-13阿里巴巴,Eddie Wu(CEO)I can tell you that today, there isn't a single card on our servers that is idle.
2026-05-13阿里巴巴,管理層the cost for us to deploy one new server this year is double what that same server would have cost a year ago. So the cost inflation has been over 100% … we have a certain pricing power with respect to new customers and also old customers.
2026-05-13Nebius,管理層Three months later today, we have already contracted more than 3.5 gigawatt, and we are now targeting at least 4 gigawatt of contracted power this year. Today, we announced … a new site in Pennsylvania to support 1.2 gigawatt of power once fully lived -- live.
2026-05-13Nebius,Marc Boroditsky(營收長)we are sold out again in Q1, as we have for several quarters, as demand continues to significantly exceed available capacity. The vast majority of capacity coming online over the next several quarters to 12 months is already under contract or earmarked
2026-05-13Nebius,Marc Boroditsky(營收長)We just raised prices again in the latest quarter, and we are still selling out across all chip types at the higher … prices.
2026-05-13Nebius,Andrey Korolenko(基礎設施長)Pennsylvania is going to have lights up by the end of 2027 with the first around 250 to 300 megawatts probably. And then this schedule looks like adding 300 megawatts each year up to 1.2 gigawatts in total … by mid-2030 or the beginning of 2030
2026-05-13Nebius,Andrey Korolenko(基礎設施長)the NVIDIA strategic investment is meaningful across several dimensions beyond the $2 billion of equity and line of sight to 5 gigawatts of capacity commitment by the end of 2030
2026-05-07CoreWeave,管理層With more than 3.5 gigawatts of contracted power, up more than 400 megawatts this quarter alone, with the substantial majority expected to be online by the end of 2027.
2026-05-07CoreWeave,管理層CoreWeave surpassed 1 gigawatt of active power this quarter. We remain firmly on track to reach or exceed our target of more than 1.7 gigawatts by the end of 2026.
2026-05-07CoreWeave,管理層Active power now exceeds 1 gigawatt and our contracted power is more than 3.5 gigawatts, leaving us strongly positioned to meet our goal of reaching more than 8 gigawatts of active power by 2030.
2026-05-07CoreWeave,Nitin Agrawal(CFO)we remain largely sold out of our 2026 capacity with prices increasing across the board from Ampere to Hopper to Blackwell. We are seeing this extend into 2027 as well as we've begun allocating capacity, we expect to come online next year.
2026-05-07CoreWeave,Nitin Agrawal(CFO)we remain largely sold out of our 2026 capacity with prices increasing across the board from Ampere to Hopper to Blackwell.
2026-05-07CoreWeave,Mike Intrator(CEO)in the last 12 months, CoreWeave has secured 2 gigawatts worth of infrastructure. Within the last quarter, we have secured 400 megawatts … What the 5 gigawatts does for us is it gives us the ability on an opportunistic basis to accelerate
2026-04-30三星,管理層our demand fulfillment rate is now at a record low. … customers who are concerned about supply shortages are actually bringing forward their demand for 2027 already. … the supply demand gap is looking to widen further in 2027 versus this year.
2026-04-30三星,管理層our production ready capacity is fully booked and sold out. … supply volume expected to scale meaningfully in the second half of the year. HBM4 sales are expected to exceed 50% of total HBM sales from the third quarter onward
2026-04-29Amazon,Andy Jassy (CEO)Our Tranium 2 chip … is largely sold out. Tranium 3, which just started shipping at the start of 2026 … is nearly fully subscribed. And much of Tranium 4, which is still about 18 months from broad availability, has already been reserved.
2026-04-29Amazon,Andy Jassy (CEO)we've recently shared very large, multi-year, multi-gigawatt tranium commitments from the two leading AI labs in the world, in Anthropic and OpenAI … we now have over $225 billion in revenue commitments for Tranium.
2026-04-29Amazon,Andy Jassy (CEO)the cost of these components, particularly memory, has skyrocketed. And we're just in a stage where there's just not enough capacity for the amount of demand. … I think we've done a good job in making sure that we're not capacity constrained there.
2026-04-29Amazon,Andy Jassy (CEO)the cost of these components, particularly memory, has skyrocketed.
2026-04-29Google,Sundar Pichai (CEO)remember in a constrained environment, when we are choosing to allocate across all these opportunities, we are working off a robust ROIC framework.
2026-04-29Meta,Mark Zuckerberg (CEO)we are rolling out more than 1 gigawatt of our own custom silicon that we're developing with Broadcom, as well as significant amount of AMD chips to complement the new NVIDIA systems that we're rolling out as well.
2026-04-29Meta,Mark Zuckerberg (CEO)our infrastructure CapEx forecast for this year. Most of that is due to higher component costs, particularly memory pricing
2026-04-29微軟,管理層Our Fairwater data center in Wisconsin came online earlier online earlier this month six weeks ahead of schedule… All up we added another gigawatt of capacity this quarter and remain on track to double our overall footprint in just two years.
2026-04-29微軟,管理層Even with these additional investments and… efforts to bring GPU, CPU, and storage capacity online faster, we expect to remain constrained at least through 2026. Despite these constraints… we expect Azure growth to show modest acceleration in the second half of the calendar year
2026-04-23SK海力士,管理層customers' demand for the next three years far exceeds our current supply capacity. … Given these severe supply shortage affecting not only HBM but also the general purpose DRAM, we are trying to achieve optimal allocation between HBM and general DRAM
2026-03-19美光,管理層We expect both DRAM and NAND industry bit demand in calendar 2026 to be constrained by supply. We continue to expect supply-demand conditions for both DRAM and NAND to remain tight beyond calendar 2026. … DRAM bit shipments in calendar 2026 to grow in the low-20s percentage range
2026-03-19美光,管理層We are now seeing NAND demand significantly in excess of our available supply for the foreseeable future. In calendar 2026, a number of factors, including DRAM and NAND supply constraints, could cause PC and smartphone units to decline in the low double digits percentage range.
2026-03-18美光,管理層HBM pricing was set for a large portion of the shipments in 2026 calendar year, late in calendar '25 … the upsides … on the HBM, we have been able to sell those for even more robust levels of pricing as those upside volumes have materialized.
2026-03-17NVIDIA,管理層Ampere that we shipped them some 6 years ago, the pricing of Ampere in the cloud is going up.
2026-03-17NVIDIA,管理層that gigawatt factory for 15 years amortized across that gigawatt factory is about $40 billion. Even when you put nothing on, it's $40 billion in.
2026-03-17NVIDIA,管理層We have now set up a supply chain that can manufacture thousands a week of these systems, essentially multi-gigawatts of AI factories per month inside our supply chain.
2026-03-11Lam,管理層WFE is going to be constrained by the amount of clean room that's available in the industry. And so end demand right now is stronger than that $135 billion. But there's only so much clean room out there. And it takes time to expand that.
2026-03-10甲骨文,管理層…structure, both GPU and CPU, continues to exceed supply. This is directly visible in our $553 billion RPO.
2026-03-10甲骨文,管理層Through our partners, we have secured more than 10 gigawatts of power and data center capacity coming online over the next three years. Those infrastructure investments also need funding and greater than 90% of that capacity is fully-funded through our partners
2026-03-10甲骨文,管理層In Q3, we delivered more than 400 megawatts to customers. 90% of that committed capacity was delivered on or ahead of schedule as we've consistently done over several quarters.
2026-03-05博通,Hock Tan, President & CEOFor Anthropic, we are off to a very good start in 2026 for 1-gigawatt of TPU compute. And for '27, this demand is expected to search in excess of 3-gigawatts of compute.
2026-03-05博通,Hock Tan, President & CEOWe also now have a sixth customer. We expect OpenAI deploying in volume their first-generation XPU in 2027 at over 1-gigawatt of compute capacity.
2026-03-05博通,Hock Tan, President & CEOMeta's custom accelerator, MDIA roadmap, is alive and well… for the next-generation XPUs, we will scale to multiple gigawatts in '27 and beyond. Rounding off for customers four and five. We see strong shipments this year, and which we expect to more than double in 2027.
2026-03-04Intel,David Zinsner, CFOfrom the perspective of what we can capture, supply is going to be our greater challenge certainly this year and probably even next year.
2026-03-04Intel,David Zinsner, CFOmy expectation is that memory is going to be short all through this year and probably all through next year. And given the importance of memory, into data center and in particular, into AI workloads, it is going to create a more significant constraint in the client space
2026-03-04微軟,Satya Nadella(CEO)that is the asymmetry we will have… between what decisions I'll make versus what you may want me to make in the short term, given the supply constraint. And so that's where we will just have to be very disciplined… we also want to be careful about pricing
2026-03-03AMD,Lisa Su(董事長暨執行長)CPU compute sitting along AI was perhaps something that was under forecasted. And so we are in the process of catching up… we will continue to increase our supply coverage as we go through this year and into next year
2026-03-03AMD,Lisa Su(董事長暨執行長)These days, I think there are multiple gigawatt scale customers. I think every lab is looking for choice at this point.
2026-02-26CoreWeave,管理層We ended the year with more than 850 megawatts of active power, adding approximately 260 megawatts in the fourth-quarter alone … ending the year with more than 3.1 gigawatts of contracted capacity, virtually all of which we expect to come online by the end of 2027.
2026-02-26CoreWeave,管理層We are also seeing significant increase in demand for prior generations of GPU architectures, where supply also remains constrained. Average H100 pricing in Q4 was within 10% of where it started the year, while average A100 pricing increased in 2025.
2026-02-26CoreWeave,管理層With largely all of our new 2026 capacity allocated,
2026-02-26CoreWeave,管理層we are accelerating our roadmap with the objective of adding more than 5 gigawatts of additional data center capacity beyond our already contracted footprint by 2030.
2026-02-26CoreWeave,管理層We expect 2026 CapEx of $30 billion to $35 billion, which is more than double our 2025 investment. Substantially, all of it is tied to our already signed customer contracts … as we expect to double our active power capacity to more than 1.7 gigawatts by year end.
2026-02-24AMD,Lisa Su(董事長暨執行長)As you know, the supply chain overall is tight, and so we're planning it very tightly together for their data center builds in terms of which data centers these things are going in.
2026-02-12Nebius,管理層We sold out of capacity in Q3 and Q4 last year, and we're already now in Q1 of 2026 also sold out. Even before we bring capacity online, it's often -- it's often sold out.
2026-02-12Nebius,管理層the prices of GPUs didn't fall, even on previous generations of GPUs as the industry may have expected.
2026-02-12Nebius,管理層We are already at more than 2-gigawatt now in February, which is why we are raising our forecast for 2026 to more than 3-gigawatt. And we are well on track to deliver 800 megawatts to 1-gigawatt of those as available data center capacity
2026-02-12Nebius,Marc Boroditsky(營收長)In Q4, we saw nearly twice as many transactions completed over 12 months in duration over what we succeeded with in Q3, while average selling prices increased by more than 50% … we are sold out of Hoppers … while we're actually seeing pricing nudging up.
2026-02-11美光,管理層Our HBM capacity is ramping well, and we have sold out our calendar year '26 HBM supply as we highlighted a few months ago. Our HBM yield is on track. Our HBM4 yield is on track.
2026-02-05Amazon,Andy Jassy (CEO)We're seeing very strong demand for Trainium3, and expect nearly all of our Trainium3 supply of chips to be committed by mid-2026.
2026-02-05Amazon,Andy Jassy (CEO)If you look in the last 12 months, we added 3.9 gigawatts of power. Just for perspective, that's twice what we had in 2022 … We expect to double it again by the end of '27. We added 1.2 gigawatts of power in Q4
2026-02-05Amazon,Andy Jassy (CEO)I think every provider would tell you, including us, that we could actually grow faster if we had all the supply that we could take.
2026-02-04Google,Sundar Pichai (CEO)we've been supply-constrained, even as we've been ramping up our capacity. … some of the time horizons are increasing in the supply chain … And so I do expect to go through the year in a supply-constrained way.
2026-02-04高通,Cristiano Amon, President & CEOAs memory suppliers redirect manufacturing capacity to HBM to meet AI data center demand, the resulting industry-wide memory shortage and price increases are likely to define the overall scale of the handset industry through the fiscal year.
2026-01-29SK海力士,管理層ASP was mid-20% Q-o-Q, ref lecting a significant increase in conventional DRAM prices. … ASP also increased low 30% Q-o-Q as price increases accelerated. Driven by substantial price increases, profitability improved for both DRAM and NAND.
2026-01-29SK海力士,管理層With memory being seen as the bottleneck in data center infrastructure expansion, server customers are expected to keep trying to increase purchase to secure their volume. … The tight inventory trend, particularly for server DRAM, is expected to continue throughout the year.
2026-01-29三星,管理層Next, regarding our 2026 HBM sales outlook, all production-ready capacity is currently fully booked with customer POs, and we expect 2026 HBM sales to improve substantially
2026-01-29三星,管理層Now, due to limited cleanroom availability, supply growth is expected to be constrained in 2026 and 2027, and we expect supply shortages to continue. We have been receiving requests from customers for multi-year supply commitments
2026-01-28GE Vernova,管理層we continue to see very strong new gas contracts with an incremental 6 gigawatts signed in the last three weeks of December for a total of 24 gigawatts of new contracts in 4Q '25 alone.
2026-01-28GE Vernova,管理層backlog and slot reservations increased from 62 gigawatts to 83 gigawatts sequentially … We expect to reach approximately 100 gigawatts under contract in '26 under the assumption we'll ship high-teens in gigawatts this year, with new contracts north of 30 gigawatts.
2026-01-28GE Vernova,Scott Strazik(CEO)the 83 gigawatts that we now have on capacity is certainly very heavily playing into '29, but there are slots in '30 and beyond that are also secured. … by the time we get to a 100 gigawatts … that a 100 gigawatts directionally will have both '29 and '30 largely sold out
2026-01-28Lam,管理層Our initial 2026 view is for WFE to be in the $135 billion range with the growth in spending remaining constrained by a shortage of available cleanroom space. Chipmakers … also commented on sold-out conditions persisting
2026-01-28Lam,管理層I think it sets up for '27 to also be a pretty good year … the industry seems to be sold out for most of what it's supplying and everybody is talking about these multi-year agreements that they're working on. … there's just not enough cleanroom out there.
2026-01-28Meta,Susan Li (CFO)we do continue to be capacity constrained. … demands for compute resources across the company have increased even faster than our supply. … we'll likely still be constrained through much of 2026 until additional capacity from our own facilities comes online later in the year.
2026-01-28微軟,管理層All up, we added nearly 1 gigawatt of total capacity this quarter alone.
2026-01-28微軟,管理層and across workloads, customer segments and geographic regions, and demand continues to exceed available supply.
2026-01-28微軟,管理層revenue increased 2% and 1% in constant currency, ahead of expectations, driven by demand for our hybrid solutions… as well as higher transactional purchasing ahead of memory price increases.
2026-01-22Intel,Lip-Bu Tan, CEOpartnering with key customers to support their needs beyond 2026. The continuing proliferation and diversification of AI workloads is placing significant capacity constraints on traditional and new hardware infrastructure
2026-01-22Intel,Lip-Bu Tan, CEOI think the EMIB-T, I think, is a very big differentiator for us. And then clearly, we have a couple of customers willing to even prepay the subscript -- because [ subscript ] is very big supply shortage
2026-01-15台積電,Jeff Su, Director of IRwe have guided for the AI CAGR to grow mid- to high 50s CAGR in the 5-year period from 2024 to 2029. So that is the official guidance we have provided just today.
2026-01-06NVIDIA,管理層We're still working on in '26. There is still a shortage of demand, and they are still looking to are ther quick ads that we could also add in '26 to help fuel what we need in terms of our demand.
2026-01-06NVIDIA,Colette Kress(財務長)So the demand as we see continues to increase as folks are to looking to enable more compute… since our time that we said $0.5 trillion, of course, we've seen new announcements of new deals
2025-12-18美光,Sumit Sadana(EVP 暨商務長)the HBM supply for 2026, we have reached agreements on volume and price with our customers. … So we are more than sold out. … this is just consistent with an environment where the demand is substantially higher than supply for the foreseeable future.
2025-12-17美光,管理層supply constraints are contributing to tight market conditions and we expect these conditions to persist beyond calendar 2026. We are making progress with customers in our discussions for multiyear contracts with specific commitments.
2025-12-17美光,Sanjay Mehrotra(CEO)our HBM for 2026 is sold out in terms of volume and our negotiations with customers have been completed for calendar year 2026 for volume as well as pricing.
2025-12-11博通,Hock Tan, President & CEO10 gigawatts between 2026 to more like '27, '28, '29. Ben, not '26. It's more like '27, '28, '29, 10 gigawatts. That was the OpenAI discussion… We do not expect much in '26.
2025-12-10AMD,管理層what they're telling us is actually they are constrained by the compute, by the infrastructure. If they have more compute, they actually can support more applications, they can tie their investment with revenue
2025-12-10Intel,John Pitzer, VP Corporate Planning & IRthe demand surge we're seeing is not just for Granite, it's for Emerald Rapids and Sapphire Rapids as well… if we have more Granite wafers, we'd be able to sell more Granite product. And so constraints are across the board, but most pronounced where we have most of our volume.
2025-12-10甲骨文,管理層In the last quarter, we handed over close to 400 megawatts of data center capacity to our customers. We also delivered 50% more GPU capacity this quarter than Q1.
2025-12-03AMD,Lisa Su(董事長暨執行長)this is a big multigenerational, multi-gigawatt partnership. We have a number of others that are at similar scale, similarly multi-generation.
2025-12-03Intel,John Pitzer, VP Corporate Planning & IRmultiple CSPs that are looking for longer-term supply agreements that stretch out beyond next year… we now are undershipping demand, both on the client side and on the data center side… the peak about the supply shortages occurring in Q1… still going to be short… even after Q1
2025-12-02NVIDIA,Colette Kress(財務長)Not only are they interested in terms of now for the CSP, they're also looking in terms of 1 gigawatt in terms of the future to do that.
2025-12-01Credo,Bill Brennan, President, CEO & Chairmanthe market in general is going to kind of quickly get to the point where we're kind of almost self-regulated by foundry capacity… from an advanced node perspective, I think it's going to be a more frequent conversation about capacity constraints at a wafer level.
2025-11-19美光,管理層And that market, just like DRAM, the pricing has gone up substantially.
2025-11-11AMD,Lisa Su(董事長暨執行長)as much as we like the headline numbers of 6 gigawatts over the next 4 or 5 years, it's a very disciplined engagement on what do you need each year… the first gigawatt will start in the second half of '26 and will go into '27.
2025-11-11Nebius,Arkady Volozh(CEO)Q3 demand was very strong. We sold out all of our available capacity. We continue to see a consistent trend. Every time we bring capacity online, we sell it all of it.
2025-11-11Nebius,Arkady Volozh(CEO)Capacity today is the main bottleneck to revenue growth … As we look to 2026, we expect our contracted power to grow to 2.5 gigawatt contracted. This is up from the 1 gigawatt … approximately 800 megawatt to 1 gigawatt by the end of 2026
2025-11-10CoreWeave,Michael Intrator(CEO)We continue to operate in a highly supply-constrained environment where the demand for CoreWeave best-in-class AI cloud platform far exceeds available capacity.
2025-11-10CoreWeave,Michael Intrator(CEO)We expanded our active power footprint by 120 megawatts sequentially to approximately 590 megawatts, while growing our contracted power capacity over 600 megawatts to 2.9 gigawatts … more than 1-gigawatt of contracted capacity available to be sold
2025-11-10CoreWeave,管理層we now expect 2025 revenue in the range of $5.05 billion to $5.15 billion. In addition, we anticipate 2025 adjusted operating income between $690 million to $720 million, and expect to end the year with over 850 megawatts of active power.
2025-11-05高通,Cristiano Amon, President & CEOWe are very pleased to have HUMAIN as our first customer for these solutions with a target deployment of 200 megawatts starting in 2026.
2025-10-30三星,管理層This constrained supply condition is expected to continue next year as well. … next year amid overall bullish market conditions, even when assuming our CapEx and expansion and maximum production, customer demand will still exceed available supply
2025-10-30Amazon,Andy Jassy (CEO)3.8 gigawatts of capacity in the last year with another gigawatt plus coming in the fourth quarter, and we expect to double our overall capacity by the end of 2027.
2025-10-30Amazon,Andy Jassy (CEO)overall in the industry, maybe the bottleneck is power. I think at some point, it may move to chips, but we're bringing in quite a bit of capacity. And as fast as we're bringing in right now, we are monetizing it.
2025-10-29SK海力士,管理層The company's HBM supply will remain tight compared to demand into 2027, but we will continue to do our best to supply products that meet customers' needs in a timely and secure manner.
2025-10-29SK海力士,管理層Some customers are very much actively responding to the current supply shortage by issuing pre-purchase POs for 2026. Now given the customer's demand and the company's capacity, the next year not only HBM, but DRAM and NAND capacity as essentially is sold out.
2025-10-29Google,Anat Ashkenazi (CFO)the fact that we're unable to meet at this point customer demand. We have more demand than we have supplied.
2025-10-29Meta,Susan Li (CFO)we wish we had more capacity today than we do. … we'd be able to put it towards good and ROI-positive use in the core business as well. So we're really trying to plan ahead not only to ensure that we have the capacity we need in 2026, but also … '27 and '28.
2025-10-29微軟,管理層We will increase our total AI capacity by over 80% this year and roughly double our total data center footprint over the next 2 years… Fairwater in Wisconsin, which will go online next year and scale to 2 gigawatts alone.
2025-10-29微軟,管理層demand remains significantly ahead of the capacity we have available… Therefore, we now expect to be capacity constrained through at least the end of our fiscal year.
2025-10-16台積電,C.C. Wei, Chairman & CEOmy customer say that 1 gigawatt, they need about -- invest about 50 billion, how much of TSMC's wafer inside, we are not ready to share with you yet because of different from different projects
2025-10-07AMD,Lisa Su(董事長暨執行長)revenue for this deal starts in the second half of '26. We would expect for each gigawatt of compute, significant double-digit billions of revenue for us.
2025-09-24美光,Mark Murphy(CFO)DRAM will remain very tight, as we talked about through the year. So we would expect to be below target.
2025-09-24美光,Sanjay Mehrotra(CEO)HBM3E, as we mentioned, pricing agreements are done with the vast majority of our HBM3E -- for our vast majority of our HBM3E supply. And volume is also fixed for HBM3E with most customers.
2025-09-23美光,管理層the HBM4 cost is higher than the HBM3 cost and the HBM4 price will be meaningfully higher than the HBM3E price.
2025-09-08NVIDIA,Colette Kress(財務長)We already have had discussions to where we probably will see several gigawatt needs for our Vera Rubin. So we've already likely seen that and pencil that in.
2025-09-03AMD,管理層when we look at the continued capacity constraint for compute, not only on the GPU side, we actually start to see with AI adoption, it drives the demand for general compute
2025-08-28Marvell,Chris Koopmans, President & COOCertainly, the supply chain is very tight, requires very
2025-08-27CoreWeave,Nitin Agrawal(CFO)we're still in a chronically supply-constrained environment where capacity constraints, especially around powered shell capacity is the biggest constrained driver for our growth. We're still in an environment where demand outstrips supply
2025-08-27CoreWeave,Nitin Agrawal(CFO)We have 2.2 gigawatts of contracted power in our portfolio … We have 470 megawatts of active power at the end of Q2 … by the end of the year, we are projecting to be over 900 megawatts of active power.
2025-08-12CoreWeave,管理層we ended the quarter with nearly 470 megawatts of active power, and we increased total contracted power approximately 600 megawatts to 2.2 gigawatts … We are now on track to deliver over 900 megawatts of active power before the end of the year.
2025-08-12CoreWeave,管理層Upon closing, CoreWeave would own approximately 1.3 gigawatts of gross power capacity across Core Scientific's national data center footprint, with an incremental 1 gigawatt or more available for future expansion.
2025-08-12CoreWeave,Nitin Agrawal(CFO)Our growth continues to be capacity constrained with demand outstripping supply.
2025-08-11美光,管理層So really, this is primarily about pricing and pricing has been strong across end markets. … the pricing trends have been robust, and we have had great success in being able to push that pricing up across those end markets
2025-08-07Nebius,管理層By the end of this year, we expect to have secured 220 megawatts of connected power that is either active or ready for GPU deployment … we're in the process of securing more than 1 gigawatt of power by the end of 2026
2025-07-31三星,管理層market prices are expected to increase by a greater margin the second half for DRAM, while NAND is also expected to see an overall rally in pricing from the third quarter. … legacy DRAM and planar NAND where there's increasingly tight supply may rise by bigger extent
2025-07-31Amazon,Andy Jassy (CEO)we have more demand than we have capacity at this point. And I think that -- and you see some of the constraints and they kind of exist in multiple places, the single biggest constraint is power. But you also see constraints off and on with chips
2025-07-30Meta,Mark Zuckerberg (CEO)Our Prometheus cluster is coming online next year, and we think it's going to be the world's first gigawatt-plus cluster.
2025-07-30Meta,Mark Zuckerberg (CEO)We're also building out Hyperion, which will be able to scale up to 5 gigawatts over several years, and we have multiple more titan clusters in development as well.
2025-07-30微軟,管理層We stood up more than 2 gigawatts of new capacity over the past 12 months alone. And we continue to scale our own data center capacity faster than any other competitor.
2025-07-30微軟,管理層Even as we continue bringing more data center capacity online, we currently expect to remain capacity- constrained through the first half of our fiscal year.
2025-07-23Google,Anat Ashkenazi (CFO)While we have been working hard to increase capacity and have improved the pace of server deployment, we expect to remain in a tight demand-supply environment going into 2026.
2025-06-11NVIDIA,Jensen Huang(執行長)Over the last couple of years, these companies have been building up their offtake… Nobody puts 5 gigawatts down and then wait for supply -- wait for demand. That's not going to happen.
2025-05-20Nebius,Roman Chernin(CBO)our base case assumes that we grow our capacity to support this type of revenue goal from 2025 levels of 100 megawatts, our ambition is to grow much larger and much faster. For that, we are building a data center pipeline to provide scalability to more than 1 gigawatt of power.
2025-05-14CoreWeave,管理層AI growth and adoption remain severely limited by capacity constraints. CoreWeave is scaling as fast as it can to meet the demands of our customers.
2025-05-14CoreWeave,管理層Today, we benefit from a network of 33 purpose-built AI data centers across the U.S. and Europe, supported by 420 megawatts of active power. Our total contracted power extends to approximately 1.6 gigawatts
2025-04-30微軟,管理層while we continue to bring data center capacity online as planned, demand is growing a bit faster. Therefore, we now expect to have some AI capacity constraints beyond June.
2025-04-17台積電,C.C. Wei, Chairman & CEOdo we still see demand exceeding supply for CoWoS in 2026? … Well, we will work very hard to make sure that we don't have this demand much, much higher than the capacity. We're working very hard, and I believe that it will be more balance
2025-03-20美光,管理層increased our HBM TAM estimate for calendar 2025 to over $35 billion. … Micron has sold out of our HBM output in calendar 2025. We are seeing strong demand for our HBM supply in 2026 and are in discussions with our customers on agreements for their calendar 2026 HBM demand.
2025-03-19NVIDIA,管理層$100 billion data center, okay? Which is only 2 gigawatts, by the way. Every gigawatt is about $40 billion, $50 billion to NVIDIA, right? Every gigawatt of data center is about $50 billion roughly
2025-03-10甲骨文,管理層we expect that our available power capacity will double this calendar year and triple by the end of next fiscal year. As we bring more capacity online, our revenues will clearly accelerate.
2025-03-06Meta,管理層We've announced we're spending $65 billion on -- $60 billion to $65 billion this year. A lot of that is on AI infrastructure. Mark shared this picture of a data center, a 2 gigawatt data center we're designing now, which is about the size of Manhattan.
2025-03-05Google,Anat Ashkenazi (CFO)we had a very strong demand from customers. And we didn't have the capacity to match that demand. … we ended the year with more demand than supply
2025-02-20Nebius,管理層Our guidance calls for 100 megawatt in operations by end of this year, and we are on track to deliver that … all these new facilities are potentially scalable to a total of more than 300 megawatts
2025-02-06Amazon,Andy Jassy (CEO)I think the world is still constrained on power from where I think we all believe we could serve customers if we were unconstrained. There are some components in the supply chain like motherboards too that are a little bit short in supply
2025-02-05高通,Akash Palkhiwala, CFOthe TSMC price increases for 3 and 4 nanometer did kick in in January. And so, as we've said in the past, our objective there is to reflect the cost increases in ASPs over a period of time.
2025-01-29Meta,Mark Zuckerberg (CEO)I announced last week that we expect to bring online almost 1 gigawatt of capacity this year
2025-01-29Meta,Mark Zuckerberg (CEO)we're building a 2 gigawatt and potentially bigger AI datacenter, that is so big that it will cover a significant part of Manhattan if it were placed there.
2025-01-29微軟,管理層while we expect to be AI capacity constrained in Q3, by the end of FY25 we should be roughly in line with near-term demand given our significant capital investments.
2024-12-18美光,管理層We have increased our HBM market TAM estimate to now exceed $30 billion in 2025 … As we have said before, our HBM is sold out for calendar 2025, with pricing already determined for this time frame.
2024-12-11微軟,管理層We can now bring that back online. It has 874 megawatts of electricity. That's more than enough to power half a million homes with electricity. So we think it's a smart investment
2024-12-09甲骨文,管理層the largest data center we're currently building now is 1.6 gigawatts. So that's quite a range, 50 megawatts to 1.6 gigawatts.
2024-10-31三星,管理層I think supply of bit growth will likely be constrained to a certain extent for next year. In addition for DRAM, as production is concentrated on HBM, the existing outlook for production growth for conventional products would be constrained.
2024-10-30微軟,管理層We expect the contribution from AI services to be similar to last quarter, given the continued capacity constraints as well as some capacity that shifted out of Q2. And in H2, we still expect Azure growth to accelerate from H1 as our capital investments create… AI capacity
2024-10-29Google,Sundar Pichai (CEO)the world's first corporate agreement to purchase nuclear energy from multiple small modular reactors, which will enable up to 500 megawatts of new 24/7 carbon-free power.
2024-10-17台積電,C.C. Wei, CEOtoday's situation is our customers' demand far exceeds our ability to supply. So even we work very hard and increase the capacity by about more than twice, more than 2 times as this year compared with last year, and probably double again, but still not enough.
2024-09-25美光,管理層As we have said before, our HBM is sold out for calendar 2024 and 2025, with pricing already determined for this time frame.
2024-09-25美光,Mark Murphy(CFO)The market's leading-edge is very tight. … in HBM, of course, is creating supply constraints in the marketplace as share bits increase. So we still see that the supply-demand environment is healthy through the year.
2024-09-09甲骨文,Lawrence J. Ellison(董事長兼技術長)Today, Oracle has 162 cloud data centers, live and under construction throughout the world. The largest of these data centers is 800 megawatts … Soon, Oracle will begin construction of data centers that are more than a gigawatt.
2024-09-05博通,Hock Tan, President & CEOyou start to hear them talk in terms of power… 500 megawatt, 1 gigawatt… We continue to see that probably going forward over the next 12 months, especially related to XPUs getting deployed… Have you been able to meet that upside…? … We can meet those upsides.
2024-08-28美光,Sanjay Mehrotra(CEO)I also feel very good about Micron's position with HBM for not only just this calendar year, but calendar year 2025 also. Not only the volume is sold out but our pricing is largely determined for all of 2025 as well.
2024-07-30AMD,管理層I will say that the overall supply chain is tight and will remain tight through 2025.
2024-07-30微軟,管理層We expect the consumption trends from Q4 to continue through the first half of the year. This includes both AI demand impacted by capacity constraints… And in H2, we expect Azure growth to accelerate as our capital investments create an increase in available AI capacity
2024-07-18台積電,C.C. Wei, CEOwhether the CoWoS capacity is now or not, is not enough. And in great shortage, and that limited my customer's growth. So we are working with our OSAT partner and try to give more capacity to my customer
2024-07-02美光,Sumit Sadana(EVP 暨商務長)We have these pricing agreements done for 2024, as well as most of 2025 pricing is also all done. We are sold out for '25 from a volume perspective, pricing almost done for all of 2025 as well.
2024-07-02美光,Sumit Sadana(EVP 暨商務長)We expect to have continued price increases in '24 calendar year. And going into fiscal and calendar '25, we obviously continue to see tight and tightening industry conditions due to the growth of HBM data center growth
2024-06-26美光,Sanjay Mehrotra(CEO)Micron drove robust price increases as industry supply-demand conditions continued to improve. … Robust AI-driven demand for data center products is causing tightness on our leading-edge nodes. Consequently, we expect continued price increases throughout calendar 2024
2024-06-26美光,管理層Our HBM is sold out for calendar 2024 and 2025, with pricing already contracted for the overwhelming majority of our 2025 supply.
2024-06-26美光,管理層We anticipate strong HBM demand due to AI, combined with increasing silicon intensity of the HBM roadmap, to contribute to tight supply conditions for DRAM across all end markets.
2024-06-11AMD,Jean Hu(財務長)for the first-half, we continue to see the tightness for both HBM and co-ops, so capacity continue to be limited, but the team continued to work with the supply chain ecosystem, will continue to improve supply in the second-half.
2024-06-11甲骨文,管理層OCI consumption revenue was up 53%, were it not for continuing supply constraints, consumption growth would have been even higher.
2024-06-11甲骨文,管理層we're now bringing 200-megawatt data centers online … And some of the data centers we have that we're planning are actually even bigger. Some are getting very close to, how dare I say it, a gigawatt
2024-06-05AMD,Jean Hu(財務長)We are [Technical Difficulty] with all three memory suppliers… We get very good support from our suppliers. And I think the capacity is still tight
2024-05-30Intel,John Pitzer, VP Corporate Planning & IRwhen you look at the sort of our supply constraints today, they're really around Gaudi and CoWoS capacity which is no different than what other players in the industry are seeing.
2024-05-21微軟,Alysa Taylor(Corporate VP, Azure & Industry)as we make sure that we are conservative in our demand forecasting, we tend to be a bit -- we have a bit more supply constraints but it's nothing material and I would say it has no impact in future forward
2024-04-30Eaton,Craig Arnold(董事長暨 CEO)we have capacity constraints on the long-cycle stuff and on the short-cycle stuff, not so much. And I think our split is roughly 75-25 between long cycle and short cycle. So maybe that's a good proxy for where we're actually at capacity or close to sold out
2024-04-25微軟,Amy Hood(CFO)I would not say that there is a capacity constraint on the Copilots… capacity constraints when we have them, you'll tend to see them on the Azure infrastructure side, the consumption side of the business is a better way of thinking about it
2024-04-18台積電,C.C. Wei, CEOthe demand is very high, extremely high. And we do our best to increase the capacity to alleviate the shortage. We also leverage the OSAT partners… probably not enough this year; but for next year, we try, we try very hard.
2024-03-20美光,管理層Micron drove robust price increases as the supply-demand balance tightened. … AI server demand is driving rapid growth in HBM, DDR5, and data center SSDs, which is tightening leading-edge supply availability
2024-03-20美光,管理層Our HBM is sold out for calendar 2024, and the overwhelming majority of our 2025 supply has already been allocated.
2024-03-20美光,管理層The industry supply-demand balance is tight for DRAM and NAND, and our outlook for pricing has increased for calendar 2024. … We expect calendar 2024 industry supply to be below demand for both DRAM and NAND.
2024-03-11甲骨文,管理層OCI consumption revenue was up 63%. Where if not for some continuing supply constraints, consumption growth would have been even higher.
2024-03-11甲骨文,管理層As our supply constraints ease revenue growth rates will accelerate higher as our capacity expands and we get into fiscal year '25.
2024-03-05AMD,Jean Hu(財務長)they have done a great job under a very tight supply constraint environment. We did secure the supplies, more than $3.5 billion.
2023-11-29NVIDIA,管理層Unfortunately, we are still supply constrained though. And it's going to take us a little while yet for us to catch up with that. We plan in terms of scaling supply both all of this year in each quarter, but we also plan that as we go into '25.
2023-10-26Amazon,Andy Jassy (CEO)there's a real shortage right now in the industry in chips. It's really hard to get the amount of GPUs that everybody wants. And so it's just another reason why Trainium and Inferentia are so attractive to people.
2023-10-26Intel,Pat Gelsinger, CEOwe saw a worldwide demand for our activities there. And overall, we're now supply constrained on Gaudi and racing to catch up to that supply worldwide.
2023-10-19台積電,C.C. Wei, CEOwe still maintain that we will double our CoWoS capacity by the end of 2024. But the total output actually is more than doubled from 2023 to 2024… this kind of a trend will continue to increase our CoWoS capacity to support our customers even into 2025.
2023-09-05Intel,Stuart Pann, SVP & GM Intel Foundry ServicesAs you probably have heard, there's a little bit of shortage in packaging in the industry. And we have a lot of capabilities in this area… So a lot of inquiries from customers around the world saying, how can you help us with more kinds of packaging capability.
2023-08-31Intel,Pat Gelsinger, CEOright now, there's an industry-wide shortage of technologies like TSMC's [colos], right? Our technology, Foveros, is a little bit different… everybody who's doing high-performance computing… driven by the AI surge… is looking at us to become a complementary advanced packagi
2023-08-01AMD,Lisa Su(董事長暨執行長)We feel that we have ample supply for an aggressive ramp in the fourth quarter and into 2024.
2023-07-20台積電,C.C. Wei, CEOwe are planning our cohorts capacity, although probably still not enough, but we're working very hard to increase it. Overcapacity, not today is a concern, that it is concerns, its not enough capacity to support all the very strong demand.
2023-05-03高通,Akash Palkhiwala, CFOwe had a price increase from foundry that ran through starting first of January as well, and some underutilization in our RF front-end fabs
Station ③ checks: if the claim is right, what we should see
Original callOn Aug 11, 2026 we said: cloud revenue growth had to catch up with the 53% to 55% hurdle rate in 2027 (then: 48.2%). The call: 53–55% in 2027 → now: 48.2% vs. a 2027 hurdle rate of 53–55%
Original callOn Aug 11, 2026 we said: cloud revenue growth had to catch up with the 53% to 55% hurdle rate in 2027 (then: 48.2%). The call: 53–55% in 2027 → now: 48.2% vs. a 2027 hurdle rate of 53–55%
Positive caseIt catches up by 2027 and revenue covers depreciation
Negative caseGrowth stalls in the 40s and the depreciation wave arrives
What the companies say (this station's timeline of statements)73
2026-09-08Google,Thomas Kurian (CEO, Google Cloud)a payback period on AI servers in aggregates is less than two years. And on our own silicon is half that. So we have strong payback period, and the majority of our infrastructure contracts. The total contract value of the infrastructure is long-term committed five-year contracts.
2026-09-02博通,Hock Tan, President & CEOevery gigawatt of compute they deploy, they could achieve $30 billion of ARR annual revenue per gigawatt. That's a hell of a business model. So for us, that's a great investment to focus on doing.
2026-08-26Intel,David Zinsner, CFOI think these margins will be in the 40%. So they'll be 40% gross, 30% operating margin business. So it's not very capital intensive relative to the front end. So the ROIC is phenomenal in that business.
2026-08-26NVIDIA,Jensen Huang(執行長)I heard the other day that return on investment capital is now less than a year. And we're talking about $50 billion data centers.
2026-08-20阿里巴巴,管理層Our AI+Cloud investment has a clear path to attractive ROIC. Our service equipped with chips, typically reach breakeven within three years. With a five-year use for life, we expect them to generate positive free cash flow at least in the two years following breakeven.
2026-08-20阿里巴巴,Eddie Wu(CEO)we can shorten the payback period for AI CapEx, for example, to 2.5 years or even 2 years … under the assumption of a three-year payback period on CapEx, theoretically, keeping our growth rate below 33% would already enable positive cash flow.
2026-08-12Coherent,管理層the investments we are making in the data center business have a roughly 18-month payback period. Our conviction in these high return investments is backed by excellent visibility from our customers with a robust pipeline of strong purchase orders and long-term agreements.
2026-08-04SpaceX(xAI),管理層The current economics have translated into a less than one-year payback on our new capital deployments for Compute.
2026-07-30三星,管理層we actually have been signing multi-year supply agreements based on a five-year term, and this is by contract subject to annual negotiations where the parties can agree to add on additional year … we have already finalized agreements with the top five global data center customers
2026-07-30Amazon,Andy Jassy (CEO)on average, it takes a little less than three years to break even on that investment. The servers currently have a useful life of at least five to six years and most of our AI capacity these days is being contracted for at least five-year terms.
2026-07-29SK海力士,管理層While the contract term normally is around five years, specific conditions may vary depending on the customer end product. … our pricing structure will also not be uniform.
2026-07-29微軟,管理層effective at the start of FY27, we are extending the estimated useful life of our data centers and office buildings from 15 to 25 years… minimal benefit to FY27 operating income. The greater impact is on capital expenditures as more of our… leases will shift… to operating leases
2026-07-29微軟,Amy Hood(CFO)All of these things contribute, obviously, to your point of increased confidence in ROIC, frankly, of the dollars that we're investing and continue to invest going forward.
2026-07-22Google,Sundar Pichai (CEO)while a short-term cost over a few months may be very high in the lifetime of the deal as we bring more capacity on is highly ROI positive, right? … a multiyear opportunity where the margins and the returns are very, very attractive over that multiyear horizon.
2026-06-24美光,管理層Typically, these agreements have a five year term from calendar 2026 through the end of calendar 2030. Automotive agreements generally have a three year term. The 16 signed agreements represent roughly 20% of our DRAM volume and a third of our NAND volume over this period.
2026-06-10甲骨文,Hilary Maxson(CFO)what we see is return on invested capital in the high 20s at a steady state, so once the revenues have ramped for large projects at the project level … the ROIC for those types of structures will be even higher.
2026-05-20NVIDIA,管理層our customers are generating profitable revenue beyond the depreciable life of their GPUs
2026-05-13阿里巴巴,Eddie Wu(CEO)today, there isn't a single card on our servers that is idle. So we see the ROI on this investment in the next three to five-year period as being extremely clear.
2026-05-13Nebius,Marc Boroditsky(營收長)This expanded new agreement is … a five-year contract for a total of $27 billion. And it is structured in two parts. First, there is a $12 billion commitment to dedicated compute capacity with delivery starting in early '27.
2026-05-07CoreWeave,管理層Customers continue to commit their foundational AI workloads to CoreWeave, resulting in weighted average contract length for new capacity remaining at approximately five years.
2026-04-29Amazon,Andy Jassy (CEO)typically six to 24 months before we start building customers … 30 plus years for data centers, five to six years for chips, servers, and networking gear. The free cash flow in ROIC for these investments are cumulatively quite attractive a couple of years after being in service.
2026-04-29Google,Sundar Pichai (CEO)I think we are doing it based on tangible demand signals we are seeing. And it's not just on the revenue side, but I'm talking from a ROIC framework and that's what is helping us navigate this moment responsibly.
2026-04-29微軟,管理層For calendar year 2026, we expect to invest roughly $190 billion in capital expenditures, which includes approximately $25 billion from the impact of higher component pricing. We remain confident in the return on these investments, given higher demand signals
2026-03-04Meta,Susan Li (CFO)That's not like, okay, in 2026, the ROI is this in 2027, the ROI is this and so on, which pains me to be clear. I really wish that, that were the world we live in, but it's not. And we have to be willing to sort of make temporal bets
2026-03-04微軟,Satya Nadella(CEO)using all the levers software gives us in managing TCO, managing utilization, optimizing the kernels by workload, ensuring that there's a diverse class of customers, using the diurnal curve… to create new SKUs… those are all things that I think will generate great ROIC.
2026-02-26CoreWeave,管理層the customers are committing their foundational AI workloads to CoreWeave for longer periods of time, resulting in the average weighted contract length increasing from … roughly four years to roughly five years.
2026-02-12Nebius,管理層As a result, the average contract duration of new cloud customers grew by 50%
2026-02-12Nebius,管理層Starting in Q1 2026, we are updating our depreciation schedule from four years to five years to reflect what we are seeing in the market and in our current utilization commitments.
2026-02-05Amazon,Andy Jassy (CEO)We expect to invest about $200 billion in capital expenditures across Amazon, but predominantly in AWS … we're monetizing capacity as fast as we can install it. … turning that capacity into strong return on invested capital. We're confident this will be the case here as well.
2026-01-28微軟,Amy Hood(CFO)a lot of the GPUs that we're buying are already contracted for most of their useful life… on the GPU contracts… those are sold for the entire useful life of the GPU… as you go through the useful life, actually, you get more and more and more efficient at delivery
2026-01-14Astera,管理層Everybody who's deploying these AI system is saying that, hey, there is ROI. They are getting returns on their investment. So -- and we see that translated into our order pattern as well. So we don't see any evidence of a slowdown in 2026 or in 2027.
2025-12-03Intel,John Pitzer, VP Corporate Planning & IRa server in the installed base that's 5 years old and you were to upgrade into a new server, that new server is going to be 80% more power efficient. And so there is a significant ROI to actually start more aggressively sort of refreshing the installed base.
2025-11-04AMD,Lisa Su(董事長暨執行長)could you tell us about the useful lives of GPUs? I know that most CSPs depreciate them over 5, 6 years… planning to sweat those GPUs for longer than that… I think we have seen some early indications of that, Antoine.
2025-10-29Meta,Mark Zuckerberg (CEO)the very worst case would be that we effectively have just prebuilt for a couple of years … there would be some loss and depreciation, but we'd grow into that and use it over time. So my view on this is that rather than continuing to be constrained on CapEx
2025-08-27CoreWeave,Nitin Agrawal(CFO)[Q: In your S-1, you talked about 2.5 years payback period on adjusted EBITDA. Is that still the right way to think about new backlog…?] Yeah. So directionally, on an aggregate basis, that continues to be the right way to think about it.
2025-07-30Meta,Susan Li (CFO)on the core AI side, we continue to see strong ROI. Our ability to measure that is quite good … On the genAI side, we are clearly much, much earlier on the return curve and we don't expect that the genAI work is going to be a meaningful driver of revenue this year or next year.
2025-07-30微軟,Amy Hood(CFO)we have $368 billion of contracted backlog we need to deliver… in terms of feeling good about the ROI and the growth rates and the correlation, I feel very good that the spend that we're making is correlated to basically contracted on the books business
2025-07-23Google,Sundar Pichai (CEO)all of that gives us confidence as we are investing in this, we will be able to have a healthy ROI on our investments. And particularly in this AI moment, there's definitely -- the value we are delivering to the customers is also growing pretty significantly
2025-06-11NVIDIA,Jensen Huang(執行長)most people might account for either four to five years, depreciate over four to five years, but their useful life is going to be five, six years, seven years.
2025-06-05博通,Hock Tan, President & CEOto drive to justify a return on investment and a lot of that investment is training and that return on investment is by creating use cases… through availability of a lot of inference. And that's what we are now starting to see among our small group of customers.
2025-05-20Nebius,管理層we apply here a four-year depreciation schedule, while others, I think, use -- typically use more of a five or a six-year depreciation schedule within our industry.
2025-05-20Nebius,Roman Chernin(CBO)Contract lengths tend to go from several months to year and beyond. In addition, as we are just starting to bring the fleet of Blackwells, that opening up more discussions about longer-term contracts.
2025-04-30Meta,Mark Zuckerberg (CEO)Even with our significant investments, we don't need to succeed in all of these areas to have a good ROI. But if we do, then I think that we will be wildly happy with the investments that we are making.
2025-04-30微軟,Amy Hood(CFO)in terms of thinking about the depreciable life of an asset, we like to have a long history before we make any of those -- changes [ph]. So we're focused on getting every bit of useful life we can… out of assets. But… that tends to be a software question more than a hardware one.
2025-03-05Google,Anat Ashkenazi (CFO)I do see a continuum of things that will have a return investment in a very, very near future. They're fairly certain such as cloud customers, versus things where you're still building … the future of AI. And everything in between such as search and YouTube.
2025-03-04微軟,Amy Hood(CFO)we look forward to continuing to be their primary partner and be able to supply them through that agreement and structure through 2030. It's a good thing for both of us.
2025-03-04微軟,Amy Hood(CFO)that is a durable asset addressing a giant TAM. And our focus on building that is because the return on invested capital on that investment is well understood by house looks much like what we've seen in the commercial cloud, it's run as a single fleet.
2025-02-20Nebius,Neil Doshi(投資人關係主管)based on some of our calculations, we believe that the payback period is somewhere between the two and a half to three-year range. And when it comes to Blackwells, the payback period on the Blackwells, it's a little too early to say
2025-02-06Amazon,Brian Olsavsky (CFO)an increased pace of technology development, particularly in the area of artificial intelligence and machine learning. As a result, we're decreasing the useful life for a subset of our servers and networking equipment from six years to five years, beginning in January 2025.
2025-02-04Google,Sundar Pichai (CEO)the proportion of the spend towards inference compared to training has been increasing, which is good because obviously, inference is to support businesses with good ROIC. And so I think that trend is good. I think the reasoning models, if anything, accelerates that trend
2025-01-29Meta,Susan Li (CFO)Our expectation going forward is that we'll be able to use both our non-AI and AI servers for a longer period of time before replacing them, which we estimate will be approximately 5.5 years. This will deliver savings in annual CapEx and resulting depreciation expense
2024-12-11微軟,管理層when you combine those two things, plus our leadership in commercial cloud today, I think we do feel quite confident in the return on invested capital. We'll see from these investments.
2024-12-03Marvell,Matt Murphy, Chairman & CEOwe announced the expansion of our strategic relationship with Amazon Web Services through a comprehensive multi-generational five year agreement. This multi-generational agreement encompasses a broad range of Marvell's data center semiconductors, including custom AI products
2024-10-31Amazon,Andy Jassy (CEO)Data centers, for instance, are useful assets for 20 to 30 years. … we can drive enough operating income and free-cash flow to make this a very successful return on invested capital business and we expect the same thing will happen here with Generative AI.
2024-10-31Nebius,Arkady Volozh(CEO)the payback period obviously depends on the generation of the GPUs. Can be somewhere around two years for the old ones and much less for the new ones.
2024-10-30Meta,Mark Zuckerberg (CEO)there are a lot of new opportunities to use new AI advances to accelerate our core business, that should have strong ROI over the next few years. So, I think we should invest more there. And second, our AI investments continue to require serious infrastructure
2024-10-17台積電,C.C. Wei, CEOlet me use 1% productivity gain, that was almost equal to about TWD1 billion to TSMC. And this is a tangible ROI benefit. And I believe we cannot be the only one company that has benefited from this AI application.
2024-09-09甲骨文,管理層an increase of the estimated lives from five years to six years effective at the beginning of this fiscal year. This change in accounting estimate reduced Q1 operating expenses by about $197 million
2024-07-31Meta,Susan Li (CFO)On our core AI work, we continue to take a very ROI based approach to our investment here. We are still seeing strong returns … Gen AI is where we are much earlier … We don't expect our Gen AI products to be a meaningful driver of revenue in 2024.
2024-07-23Google,Sundar Pichai (CEO)the risk of under- investing is dramatically greater than the risk of over-investing for us here. Even in scenarios where if it turns out that we are over-investing, we -- clearly these are infrastructure which are widely useful for us. They have long, useful lives
2024-06-05AMD,Jean Hu(財務長)more and more proof of point from productive improvement, people are getting return on investment to justify the market opportunity
2024-04-24Meta,Susan Li (CFO)In terms of measuring the ROI on our CapEx investments, we've broadly categorized our AI investments into two buckets … core AI work and then strategic bets, which would include Gen AI … we're still seeing strong returns
2024-03-07博通,Hock Tan, President & CEOIt's a great ROI as we are seeing ROI that comes very quickly. And the investment continues vigorously with those -- with that segment, comprising very few players.
2024-02-01Amazon,Brian Olsavsky (CFO)we recently completed a useful life study for our servers and we are increasing the useful life from 5 years to 6 years beginning in January 2024. We will have this anticipated benefit to our operating income of approximately $900 million in Q1
2023-12-07AMD,Jean Hu(財務長)the server depreciation life, everybody extended to six years. Beyond six years, what -- the challenges you are going to have is, with older server, you actually need more power, you need more space
2023-11-28NVIDIA,Colette Kress(財務長)you will likely see return on investment for each dollar that they are investing. They may get a return on investment of 5. That's a huge, easy math for them to do
2023-09-07微軟,Amy Hood(CFO)Azure then fully sits under every AI-enabled workload that we offer is probably the best way of thinking about it, which is far different from a decade ago and I think allows for a lot more confidence in terms of return on invested capital over a shorter period of time.
2023-07-26Meta,Susan Li (CFO)that's an area where we're able to measure the ROI of our investments there, and we feel-good about the ROI of those investments and we want to continue investing appropriately to drive revenue growth. … There is also another component, which is the next-generation AI efforts
2023-07-25微軟,管理層the change in accounting estimate for the useful life of server and network equipment resulted in $3.7 billion of depreciation expense shifting from FY '23 to future periods… that will be a headwind to growth in FY '24 as the benefit reduces to $2.1 billion
2023-04-26Meta,Susan Li (CFO)we're focused on measuring the return of those investments and making sure that we feel good about the ROI of our spend there … And then the third bucket is really around CapEx investments now to support gen AI.
2023-02-01Meta,Susan Li (CFO)The current surge in CapEx is really due to the building out of AI infrastructure, which we really began last year and are continuing into this year. We will be measuring the ROI of these AI investments, and their returns will continue to inform our future spend.
2023-02-01Meta,Susan Li (CFO)Depreciation here is impacted by us extending the useful lives of non-AI servers in Q4.
2023-01-30Google,Ruth Porat (CFO)we adjusted the estimated useful lives of servers and certain network equipment starting in Q1 '23. We expect these changes will favorably impact our 2023 operating results by approximately $3.4 billion for assets and service as of year-end 2022.
Station ④ checks: if the claim is right, what we should see
Original callOn Aug 3, 2026 we said: the hyperscalers would owe about 60% of the roughly $2 trillion 2027 AI capex bill, and the math works. The call: ~60% of $2T → now: $1.2T capex scenario: borrow $105B. $1.4T scenario: borrow $305B. Issued so far this year through mid-September: $225B
Original callOn Aug 3, 2026 we said: the hyperscalers would owe about 60% of the roughly $2 trillion 2027 AI capex bill, and the math works. The call: ~60% of $2T → now: $1.2T capex scenario: borrow $105B. $1.4T scenario: borrow $305B. Issued so far this year through mid-September: $225B
Positive caseBorrowing is lower than or about the same as this year
Negative caseBorrowing is more than double this year
Threshold:2027 bond issuance ≤ 1.5x 2026Updated:Annual
Charts 3
4b | The 2027 Funding Gap: Who Has to Borrow, and How Much (~$190B Total, Consensus as of Aug 13 2026)
Bonds Issued (Gross, $B), Quarterly and Annual
Implied Net New Financing Needed in 2026 and 2027 (Auto-Linked to the Debt Data; Assumptions Stated)
Station ⑤ checks: if the claim is right, what we should see
Original callOn Sep 21, 2026 we said: the five hyperscalers' free cash flow would break even in 2027 and turn positive in 2028. The call: 2027 breakeven, 2028 positive → now: Even in 2027; watch for the crossover in 2028
Original callOn Sep 21, 2026 we said: the five hyperscalers' free cash flow would break even in 2027 and turn positive in 2028. The call: 2027 breakeven, 2028 positive → now: Even in 2027; watch for the crossover in 2028
Positive caseBuybacks resume: there really is extra cash
Negative caseThe pause drags on and dividends get cut too
Threshold:Combined buybacks at the four hyperscalers > 0Updated:Quarterly
Charts 1
Share Buybacks ($B/Quarter)
Articles 0
—
Positive caseNo early signs of stretched valuations yet: still safe for now
Negative caseStretched valuations plus 2028 supply coming online: time to be careful
Threshold:Four early signs of the full-belief phase (see the warning-light table)Updated:Quarterly
Charts 1
Warning Lights by Section
入口頁三段時間表
Articles 0
—
Positive casePayments from real customers grow faster than deals AI companies sign with each other
Negative caseDeals inside the circle grow faster than outside money: that is what a bubble looks like
Threshold:(This is what side C tests)Updated:Event-driven
Charts 3
Circular Deals Map (Through Aug 17 2026; Ledger Cross-Checked Line by Line Twice, Plus Aug 11:12 News, CRWV/NBIS Q2 2026 Additions, and the Aug 17 NVDA × SB Energy Ohio Deal)
b Financing Loops: Who Guarantees Whom, and How the Money Comes Back Around
5a | RPO Concentration: Who's Carrying the Most Future Someone Else Signed For ($B)
Two scripts: same structure, each cell lights up when we get there
Positive script: each cell turns green when we get there
Green = the positive script is running
Real customers' money comes in
$141BAnnualized revenue of five AI companies (3Q26)Go to station ① →
Signed contracts turn into revenue
$4,040Annualized revenue per H100e (3Q26), up 206% in three quarters and up 65% in the latest quarterGo to station ② →
Payback is faster than the cost of borrowing
48%Cloud revenue growth, YoY (2Q26); Google Cloud +82%Go to station ③ →
Internally generated cash covers the spending
+40% / +40%2027 growth in operating cash flow vs. capex for the five hyperscalers: about evenGo to station ④ →
Borrow less, ratings hold, rates fall
+40% / +40%2027 growth in operating cash flow vs. capex for the five hyperscalers: about evenGo to station ④ →
Reinvest, more compute
2028The quarter when 'borrowing to invest' turns into 'printing money'Go to station ⑤ →
Negative script: each cell turns red when its signal shows up
Red = time to switch scripts
Customers stop paying
TriggerAI companies' annualized revenue adds less in a quarter than the quarter before, a new flagship model fails to win paid share, or spending by the top 1% of users flattensGo to station ① →
Signed contracts don't turn into revenue
TriggerNew chips earn less than the average chip (marginal divided by average falls below 1), or usage drops after a frontier model raises pricesGo to station ② →
Payback is slower than the cost of borrowing
TriggerThe gap between cloud revenue growth and the hurdle rate widens two quarters in a row, or depreciation starts growing faster than cloud revenueGo to station ③ →
Borrow more, at higher rates
TriggerOrder books on large bond deals fall below 2.5 times, or 40-year spreads keep widening (Amazon moving to the sterling market already counts as a small signal)Go to station ④ →
Ratings cut, spending cut
TriggerOracle's downgrade spreads to other companies, or the big four cut capex guidanceGo to station ④ →
The landlords and the supply chain hurt first
TriggerCoreWeave's CDS rises, the landlords' borrowing costs climb, or supply-chain estimates get cutGo to station ⑤ →
Which way it leans now
We are here
PositiveNegative
Positive: 1 lit, 2 in progress Negative: 0 lit, 1 small signals
Each cell on the left has its mirror image on the right. A filled cell means we are there (green) or on the way (gold); red fill means the signal has shown up. The bar in the middle shows which way things lean: more green cells push it left, red cells push it right. Click any cell to see its current number or trigger in place; use the station link to go deeper.
What would change our mind
The six triggers on the negative loop. When we see these, we change the script without waiting for the next quarter.
Customers stop payingIf AI companies' annualized revenue adds less in a quarter than the quarter before, a new flagship model fails to win paid share, or spending by the top 1% of users flattens, we turn station ① yellow.
Signed contracts don't turn into revenueIf new chips earn less than the average chip (marginal divided by average falls below 1), or usage drops after a frontier model raises prices, we turn station ② yellow.
Payback is slower than the cost of borrowingIf the gap between cloud revenue growth and the hurdle rate widens two quarters in a row, or depreciation starts growing faster than cloud revenue, we turn station ③ yellow.
Borrow more, at higher ratesIf order books on large bond deals fall below 2.5 times, or 40-year spreads keep widening (Amazon moving to the sterling market already counts as a small signal), we turn station ④ yellow.
The landlords and the supply chain hurt firstIf CoreWeave's CDS rises, the landlords' borrowing costs climb, or supply-chain estimates get cut, we turn station ⑤ yellow.
The starting point is 'supply falls short from now through next year.' Then we check whether demand really exceeds supply: demand is running ahead of supply
Only 3.1GW added in 1H27
ARR at five AI companies up $67B in one quarter
revenue per chip up 206% in three quarters
When Supply Arrives: New IT Power per Half Year (GW, Stacked by Owner)
Supply vs Demand: Cumulative H100e vs AI Companies' Combined Annualized Revenue
New ARR per Month ($B) = What Data Centers Have to Absorb
Is money from outside the circle coming in? Are payments from real customers growing faster than the deals AI companies sign with each other and the bonds they sell?
(Numbers for side C still to be built: growth in customer payments vs. growth in deals inside the circle)
New ARR per Month ($B) = What Data Centers Have to Absorb
Timeline: which station is due when
Before the line: on the base-case pathHits the breakeven lineAfter the line: money comes backThe test
Today 2026/9
End of 2026
1H 2027
Mid-2027
End of 2027
2028
Tightness Gauge: Annualized Revenue per H100e (History Plus Projection)#
Annualized revenue per H100e was about $4,000 in 3Q26 (including OpenAI's $70B run rate disclosed Sep 29), more than triple three quarters earlier; on the base case it reaches the $4,500 lower breakeven line in 2Q27.Draft, pending review
Source: FinSight compilation and estimates · Updated 2026-09-30
Tracks the real data: revenue per chip against the breakeven line, with the five due dates drawn on the chart. When the data updates, the chart moves forward on its own.
Before the line: on the base-case pathEnd of 2026
① Real customers are paying② Each chip earns more (supply can't keep up)
Market-wide AI ARR stays on the base-case path; Fable 5 share warning light
ThresholdARR ≈ $138B (base-case path)
End of 2026
① Real customers are paying② Each chip earns more (supply can't keep up)
Market-wide AI ARR stays on the base-case path; Fable 5 share warning light
Threshold:ARR ≈ $138B (base-case path)
ARR Checkpoints (Updates Live With the Slider)Back-Solved: How Much ARR It Takes to Reach the Threshold Line at Each DateModel-Layer Spend Mix: Are New Flagships Actually Getting Paid? (Ramp AI Index Model Breakdown)
Before the line: on the base-case path1H 2027
② Each chip earns more (supply can't keep up)
The half-year with the least new compute
Threshold1.41GW, only +8.9%
1H 2027
② Each chip earns more (supply can't keep up)
The half-year with the least new compute
Threshold:1.41GW, only +8.9%
When Supply Arrives: New IT Power per Half Year (GW, Stacked by Owner)New IT Power per Half Year: 5.0GW Came Online in H1 2026, 2.8GW Scheduled for H1 2027
Hits the breakeven lineMid-2027
② Each chip earns more (supply can't keep up)③ Cloud revenue catches up
Revenue per chip reaches the breakeven line; cloud margins start to improve
ThresholdAnnualized revenue per H100e ≥ $4.5k (market-wide ARR ≥ $242B)
Mid-2027
② Each chip earns more (supply can't keep up)③ Cloud revenue catches up
Revenue per chip reaches the breakeven line; cloud margins start to improve
Threshold:Annualized revenue per H100e ≥ $4.5k (market-wide ARR ≥ $242B)
Tightness Gauge: Annualized Revenue per H100e (History Plus Projection)
After the line: money comes backEnd of 2027
③ Cloud revenue catches up④ Operating cash flow keeps up with spending
ARR stays on the base-case path; operating cash flow has to grow faster than capex
ARR Checkpoints (Updates Live With the Slider)CapEx ÷ Operating Cash Flow (Capital Intensity)
The test2028
⑤ Free cash flow turns positive
A large wave of supply comes online and tests demand; early signs of the full-belief phase
ThresholdStretched valuations plus supply coming online
2028
⑤ Free cash flow turns positive
A large wave of supply comes online and tests demand; early signs of the full-belief phase
Threshold:Stretched valuations plus supply coming online
Chart 1: US GW by Year, Three Tiers (Committed → Under Construction → Online)Warning Lights Dashboard: Five Layers (Price / Volume / Structure / Concentration / Rates)
The stretch when semiconductor valuations rerate higher
The three-line history chart is still to be built (market history aligned by launch date).
History check: 1977 / 1995 / 2022, aligned at the starting point (three-line chart to come)
The three-line history chart is still to be built (market history aligned by launch date).
Start here
Three pieces that walk through the argument above from the start.