
Taiwan's inventory cycle turned bullish in the second quarter of 2019 and the electronics index is up 17.3%. History says one to two quarters left.
In our January 2020 post on the global tech map and how the tech war is redrawing it, we walked through where the world's technology production sits and how that is shifting. The point we made about Taiwan: it holds a critical position upstream in the vertical supply chain, in electronic components, where 40% of world output comes from Taiwan.
Key takeaways
- The year over year change in inventory days at Taiwan's electronic component makers runs inversely to the Taiwan Stock Exchange (TWSE) electronics sector index (the electronics index): when the change is negative the index tends to put together a real advance, and when it is positive the index chops sideways or falls.
- Since 2012 there have been four stretches where that change stayed negative. The first three ran three to four quarters and returned 15.5%, 23.7% and 23.0%.
- The current stretch started in the second quarter of 2019. Through January 6, 2020 the electronics index is up 17.3%, so on the historical pattern this bull run has one to two quarters left, which takes it into the first or even the second quarter of 2020.
- TSMC's inventory days in the fourth quarter of 2019 came in at 55, down 12 days from 67 in the fourth quarter of 2018, which argues the cycle runs further. The exit to watch is the year over year change climbing back toward a 5 day increase.
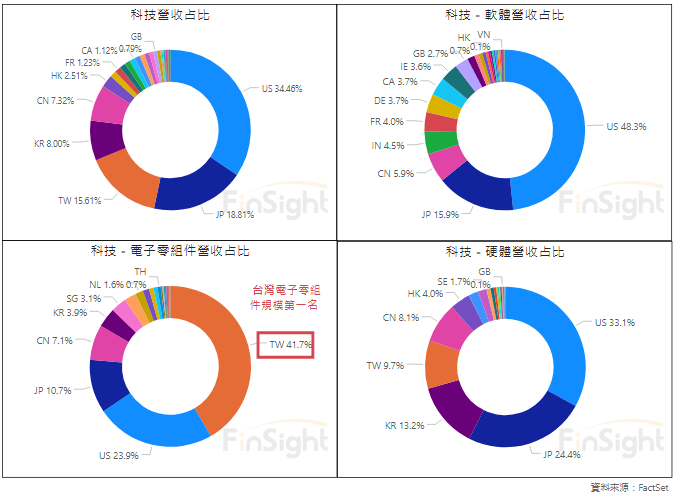
Consumer electronics markets move fast, and product cycles turn over faster than in most consumer goods, so the inventory cycle shows up in them more sharply than anywhere else. What we want to do here is use that cycle to place the electronics index in its current environment, and turn that into an investment decision.
Inventory is a leading indicator, and it tells you where the electronics index sits in the cycle
The goal is to use inventory data to identify which stage of the inventory cycle Taiwan's electronics industry is in, and to trade on it.
Taiwan's electronic components are not only critical to the global chain, they are also more than 70% of Taiwan's own tech sector. So we start with electronic components as the sample.
We use inventory days rather than the dollar value of inventory, because inventory days already adjust for the scale of revenue. To strip out seasonality we then use the year over year change in inventory days, meaning inventory days for the quarter minus inventory days in the same quarter a year earlier, and compare that with the electronics index.
The result: the two move inversely, and strongly so.
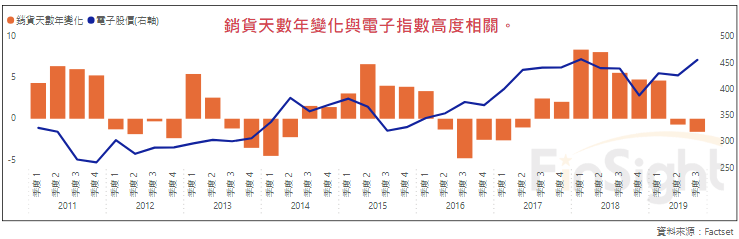
The swing in Taiwan's electronic component inventory is a bellwether for what the cloud vendors and the consumer electronics makers are doing. Read the Taiwan inventory cycle alongside what you know about the other tech names and you can see which end market is actually absorbing supply.
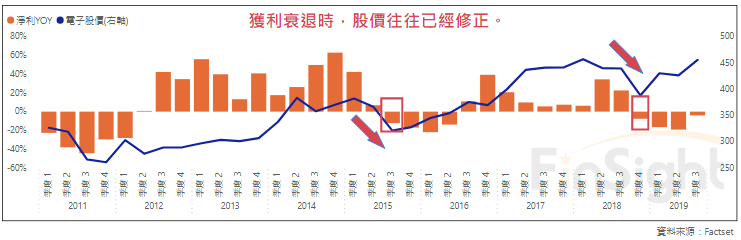
That is why the year over year change matters so much for investing. When it is negative, it is usually a good entry. Once the change approaches a 5 day increase, start cutting risk. When inventory deteriorates, profit usually follows it down, and by the time earnings start getting cut the stocks have typically already corrected a long way.
When to be in, and when to get out
We count each stretch from the point the year over year change in inventory days turns negative to the first time it turns positive again. Since 2012 there have been four of them, and the first three each carried a bull trend of three to four quarters:
- Second quarter of 2012 to first quarter of 2013
- Third quarter of 2013 to second quarter of 2014
- Second quarter of 2016 to second quarter of 2017
- Second quarter of 2019 to ?
Taiwan-listed companies file quarterly financials well after the quarter ends, so the data is not in your hands on the last day of the quarter. To keep the exercise tradeable, we align the start of each stretch with the final filing deadline for those financials. Second quarter numbers, for example, are marked to the closing price at the end of August.
On that basis the first three stretches returned 15.5%, 23.7% and 23.0%. The most recent turn negative was the second quarter of 2019, and from the closing price in the month those financials were filed through January 6, 2020, the index is already up 17.3%.
When the year over year change turns positive, the electronics index does not necessarily drop right away, but the room left on the upside is limited. Given the correction that may follow, the right move once inventory days start building again is to trim electronics exposure.
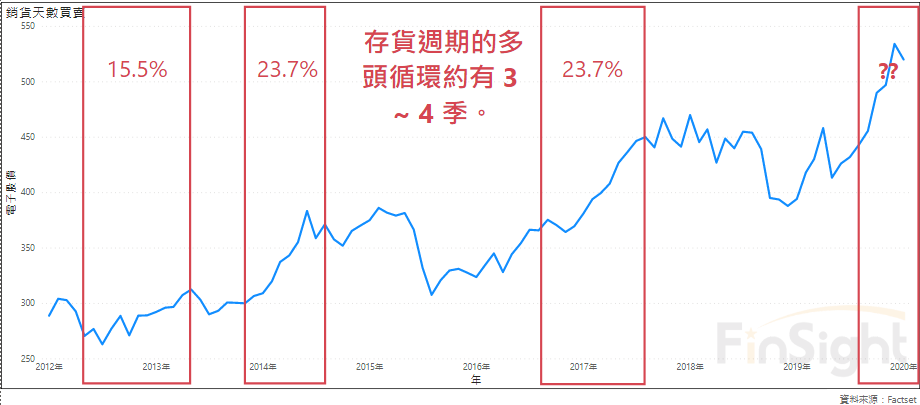
The year over year change in inventory days started falling in the second quarter of 2019. If this stretch behaves like the last three, the bull run should hold into the first quarter of 2020 and possibly the second. We are tracking the filings closely, and the moment inventory turns worse we will flag it right away.
The capital spending mix matters too, and it spreads the benefit unevenly
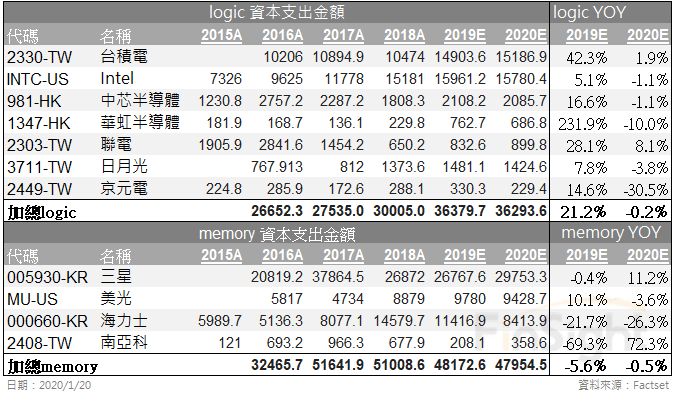
Besides inventory, we have always paid close attention to capital spending (capex) at the major manufacturers, because capex is a leading indicator in the same way inventory is. On the component side, estimated semiconductor capex for both 2019 and 2020 is roughly flat versus the prior year, but the composition is very different. In 2019 the spending concentrated in logic: logic grew 21% while memory fell 15%. In 2020 logic is flat and the decline in memory is moderating.
That difference in the composition of capex means the benefit to the upstream supply chain is spread very unevenly.
Two books on cycles worth reading: Lars Tvede's Business Cycles: History, Theory and Investment Reality on how cycle research developed, and Howard Marks's The Most Important Thing on cycles from an investing standpoint.
Putting it together: the bull market in Taiwan electronics is not over, and there should still be one to two quarters of it to own. But watch the inventory data closely, because the moment it turns worse we will change the view.
Going into this earnings season, the three indicators we are watching are inventory, capex, and how fast profit recovers.
TSMC is the bellwether of the Taiwan market, and its numbers carry signal for everyone else. Taking the results from TSMC's January 2020 call last week, inventory days in the fourth quarter of 2019 were 55, twelve days below the 67 days of the fourth quarter of 2018, which says fourth quarter sell through was strong. We think that number gives the Taiwan electronics index a good chance of extending the bull leg of the inventory cycle.