Big Tech bond sales are up eightfold in five years. By our math, 2027 needs $105B to $305B of new borrowing, which is fundable. The real test is AI payback.
Our last few posts followed where AI money is going: how pricing is splitting into tiers, how revenue is climbing in steps, and which software companies end up keeping the revenue. This post looks at the other end: where the cash to build all that compute comes from. Right now that is the market's biggest worry. Is there enough money to fund next year's spending?
Key takeaways
- Money is not the problem in 2027. Whether it becomes one in 2028 depends on how fast AI turns into revenue.
- The borrowing surge is real, but it filled a real funding gap. The five hyperscalers, the giant cloud and AI spenders (Microsoft, Google parent Alphabet, Amazon, Meta and Oracle), now sell eight times as much in bonds each year as they did five years ago. So far this year, their capital spending (capex) plus stock buybacks has run about $135B ahead of the cash their businesses brought in. Most of the $219B they borrowed through mid-August went to fill that hole, and little of it piled up: their cash is up only $48B from the end of last year.
- Next year's borrowing looks manageable. If the five spend $1.2T on capex, and first use their spare cash and the money now going to buybacks and dividends, they need to borrow $105B, less than this year. At the $1.4T figure circulating among investors they need $305B, or 1.4 times this year. Google also holds $80B of SpaceX stock it is free to sell, a further cushion. Selling it would bring the $1.4T case down to about this year's level.
- The money is there but costs more, and what it buys pays for itself in two to three years. Every large bond deal this year still drew orders for several times its size. The four largest hyperscalers (Microsoft, Google, Amazon and Meta, the big four from here on) are now borrowing at yields of 5% to 7%, while Google says its AI servers pay back in two years. Equipment that earns back its full cost in two years and keeps running for years after that is returning many times the 5% to 7% a year the debt costs.
The worry is easy to follow. Capex has grown so large that operating cash flow (the cash the business brings in before that spending) can no longer cover it along with shareholder payouts. Free cash flow (what is left after capex) is heading negative, and the difference has to be borrowed. Meanwhile tech bond issuance has surged over the past year, and long-term Treasury yields just hit their highest level since 2007. The concern is fair, and it matters for investors well beyond these five companies. Chipmakers and other suppliers are forecasting a strong 2027 on the assumption that the spending continues. If the 2027 bill can't be funded, those estimates stop being revised higher and may have to come down.
We take it in three parts: how much has to be borrowed next year, whether the market will lend it, and what this more expensive money is buying.
Question 1: How much has to be borrowed next year?
Start with this year, because it sets the yardstick for next year.
How much was borrowed this year, and why?
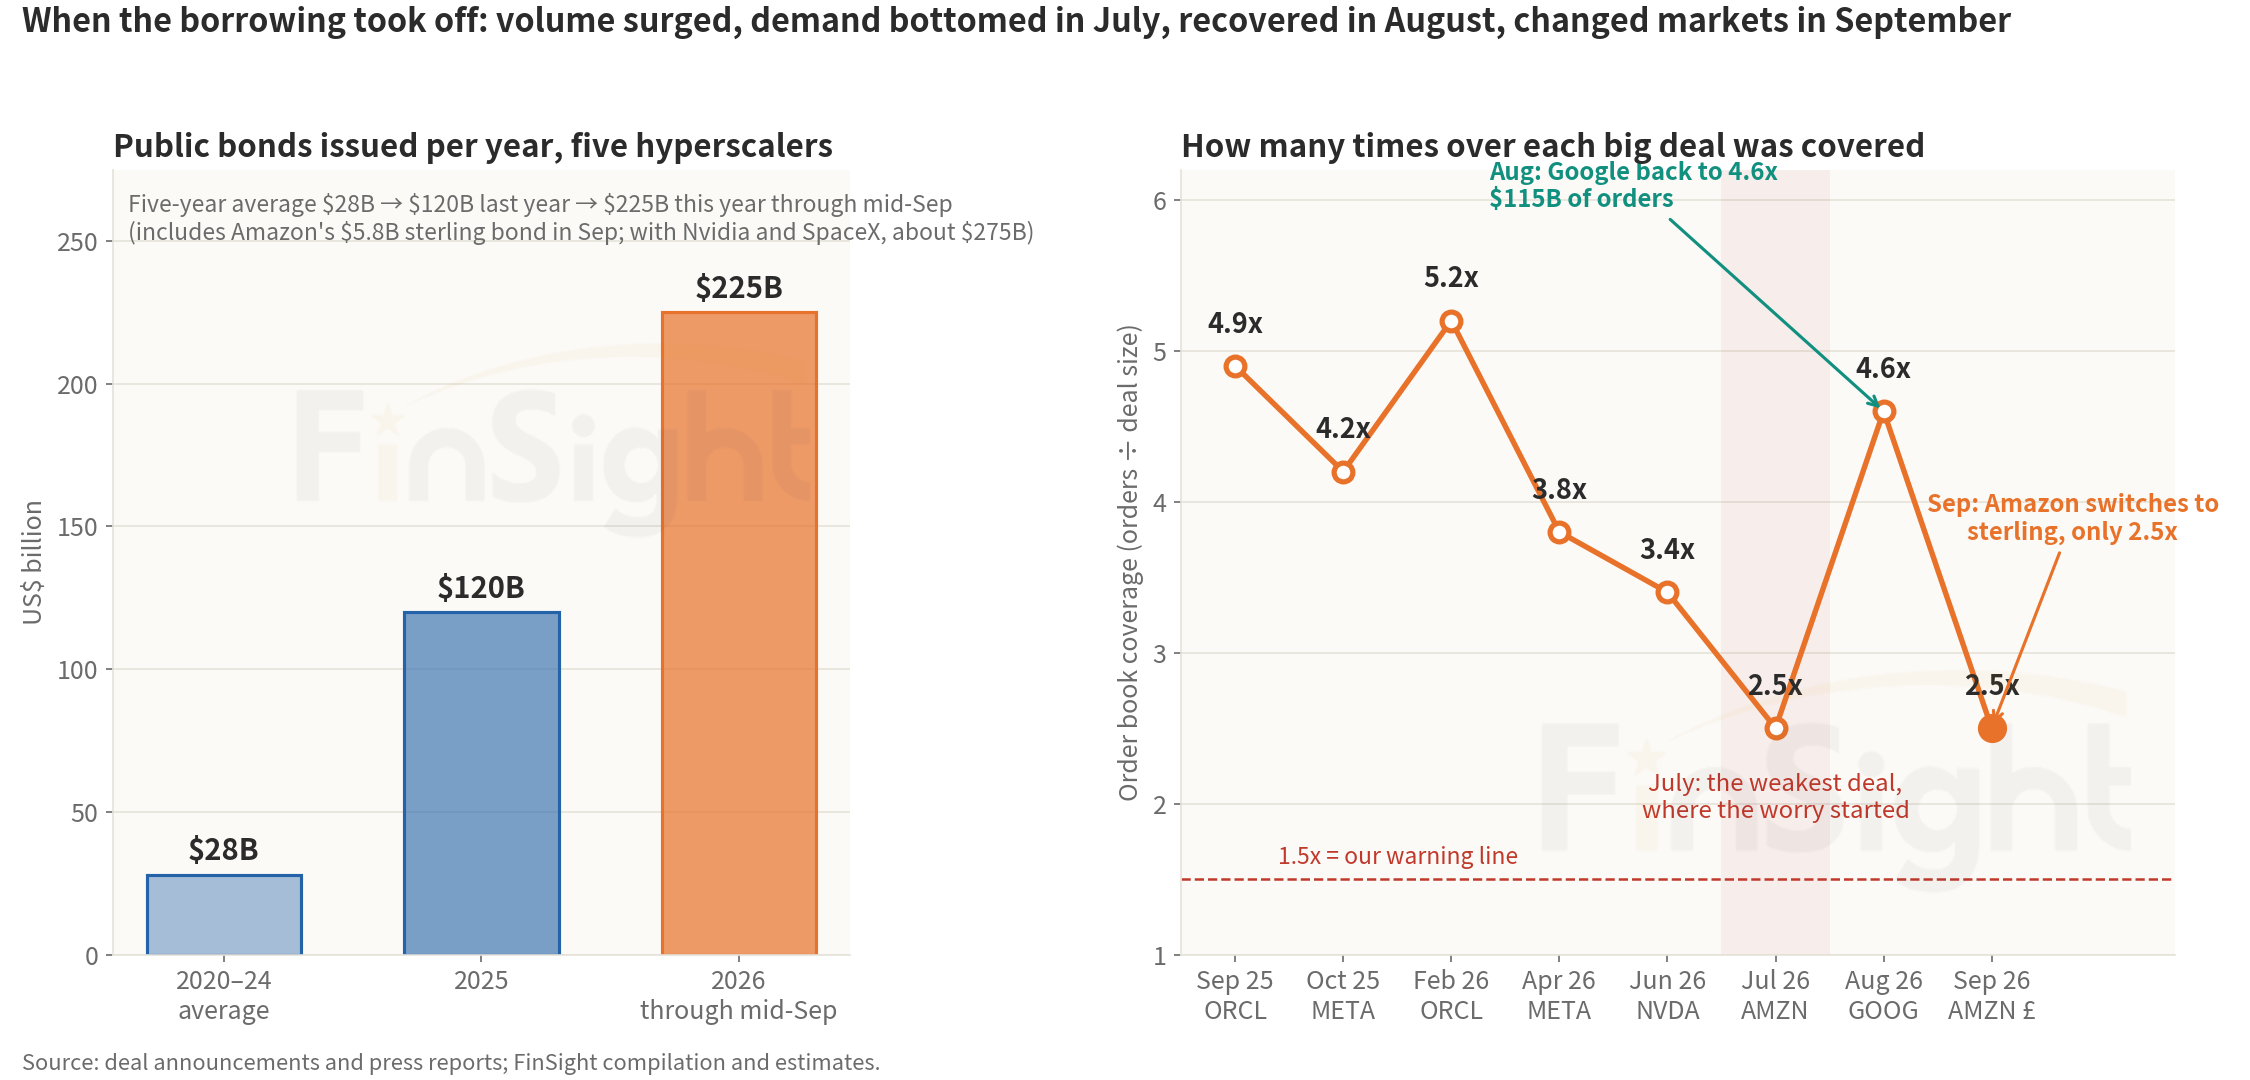
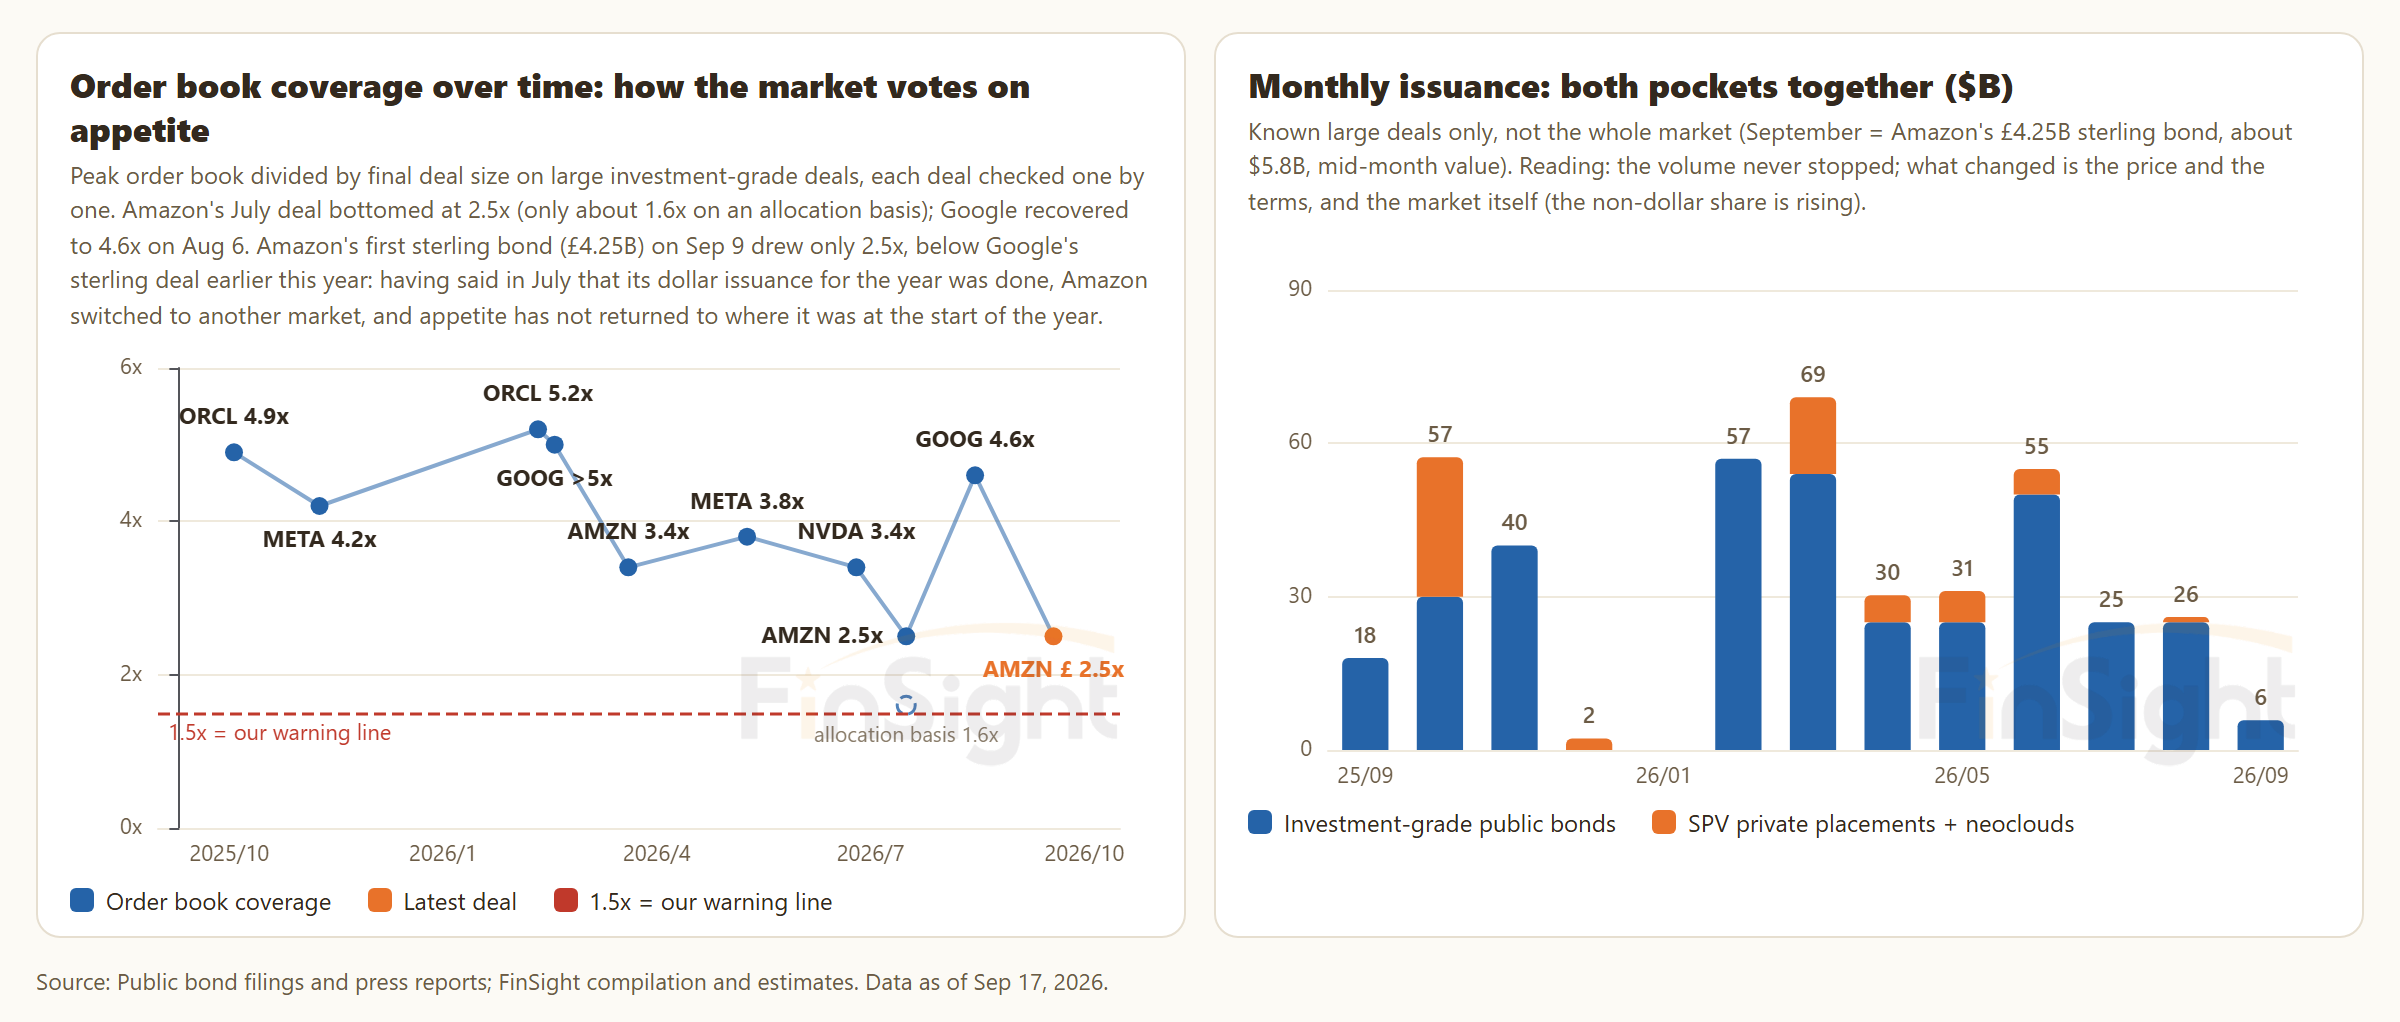
From 2020 through 2024 the five hyperscalers issued an average of just $28B a year in public bonds. In 2025 they issued $120B, and this year they are already at $225B through mid-September. Annual issuance is up eightfold in five years. Add Nvidia and SpaceX and the total is $275B, close to tenfold. (Our cash analysis stops at mid-August, when the total was $219B, so $219B is the yardstick for "this year" in the rest of this post.)
When a company sells bonds, investors place orders, and the ratio of orders to bonds on offer, known as order book coverage, shows how eager they are. As the deals got bigger, that ratio fell. Oracle's deal in September 2025 drew orders for 4.9 times the deal size. By Amazon's deal this July it was down to 2.5 times, and that is when investors started to worry. In August Google drew 4.6 times and people relaxed a little. Then in September Amazon sold bonds in British pounds and again drew only 2.5 times.
Next year's borrowing need: three numbers and a subtraction
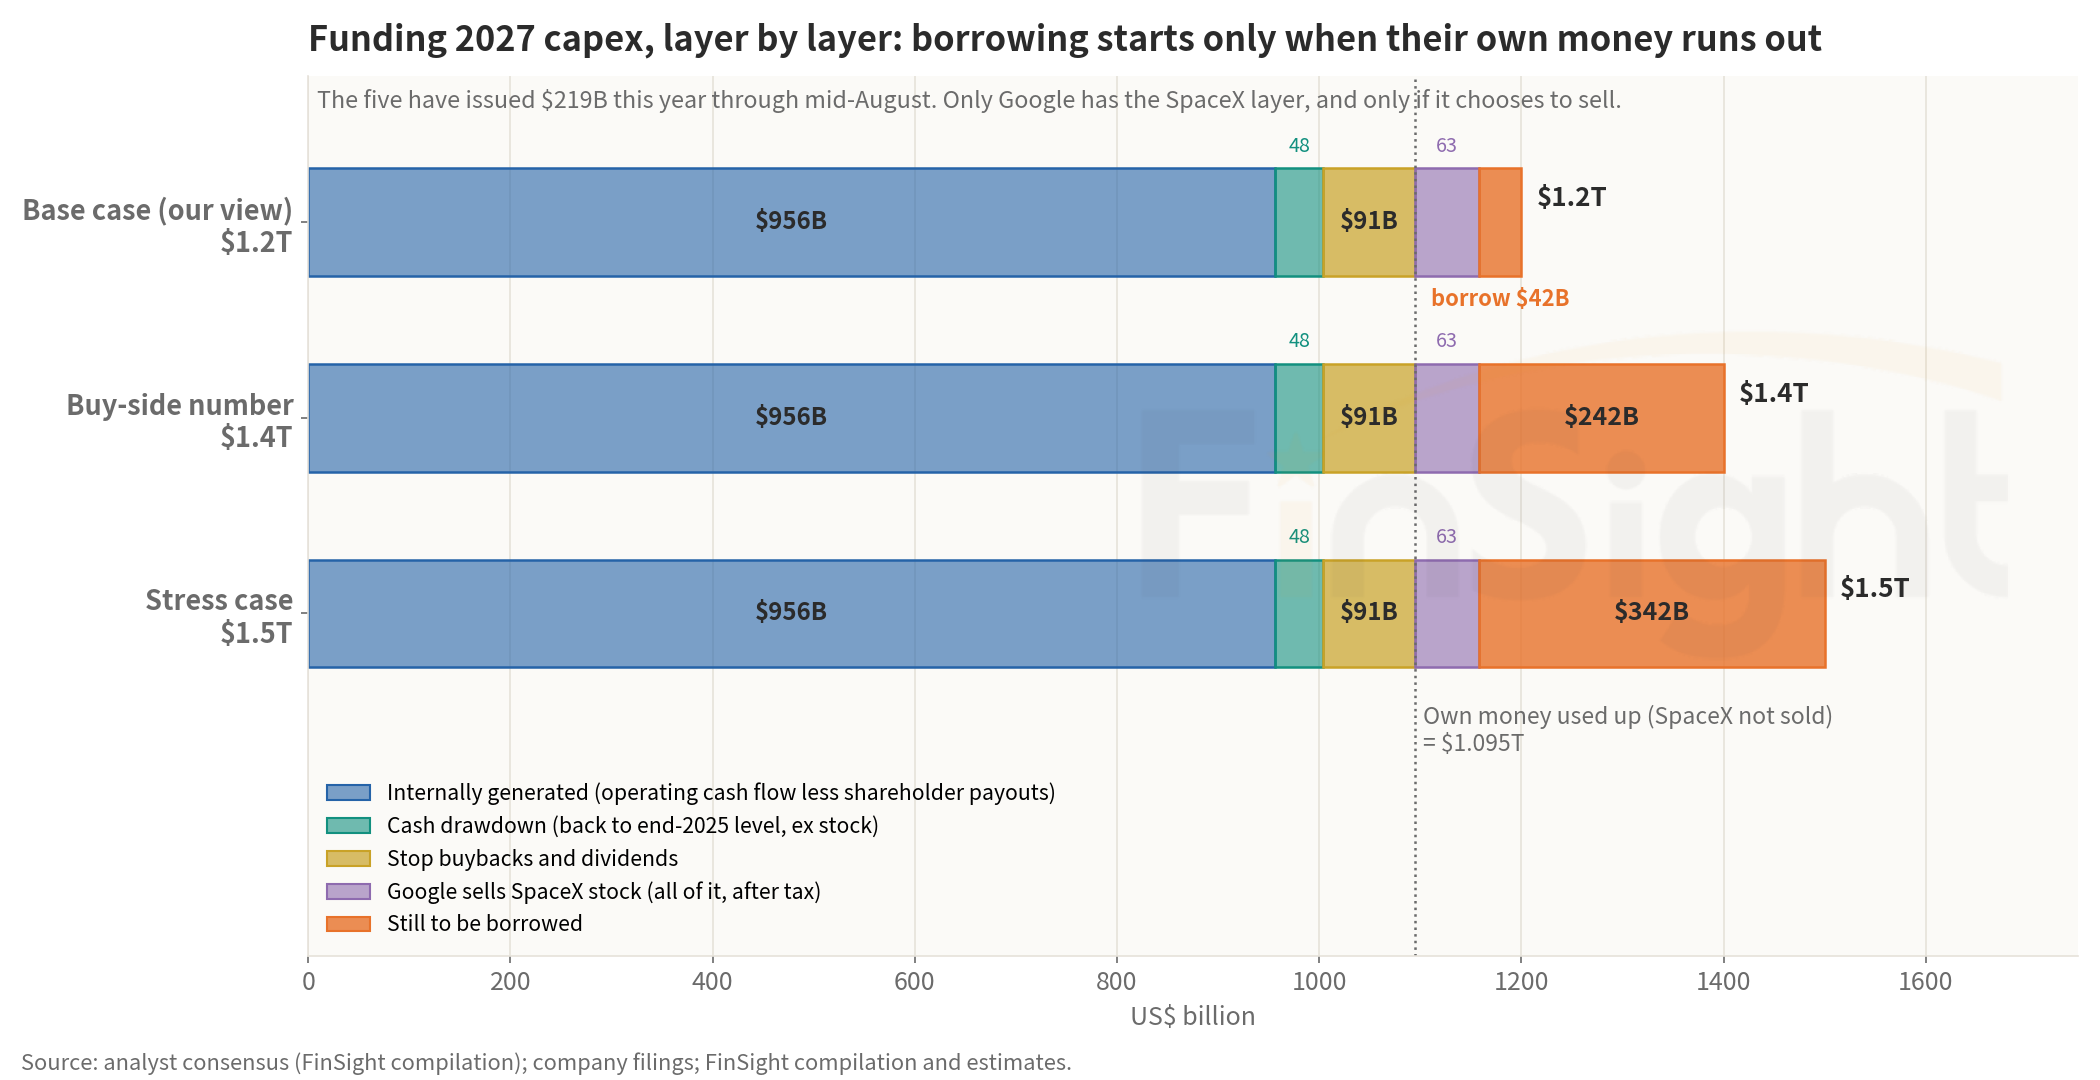
The amount to borrow is next year's capex, minus the cash the companies generate next year (operating cash flow less dividends and buybacks), minus the cash on hand they can draw on. Whatever is left has to be raised in the debt markets. This counts only the new gap. Refinancing of maturing debt is not included.
- What they bring in next year: analysts expect the five hyperscalers to generate a combined $1.047T of operating cash flow in 2027 (estimates as of mid-September). Hold shareholder payouts at this year's level, about $91B. That leaves $956B of internally generated cash to put toward capex.
- What they spend next year: the analyst consensus for capex sits at $1.11T, but that number has more than doubled over the past year and is still being revised higher every quarter. Given our view that compute stays capacity-constrained, we think 2027 reaches at least $1.2T. We add two more cases: the $1.4T figure that large investors have been passing around, and a harsher stress case of $1.5T.
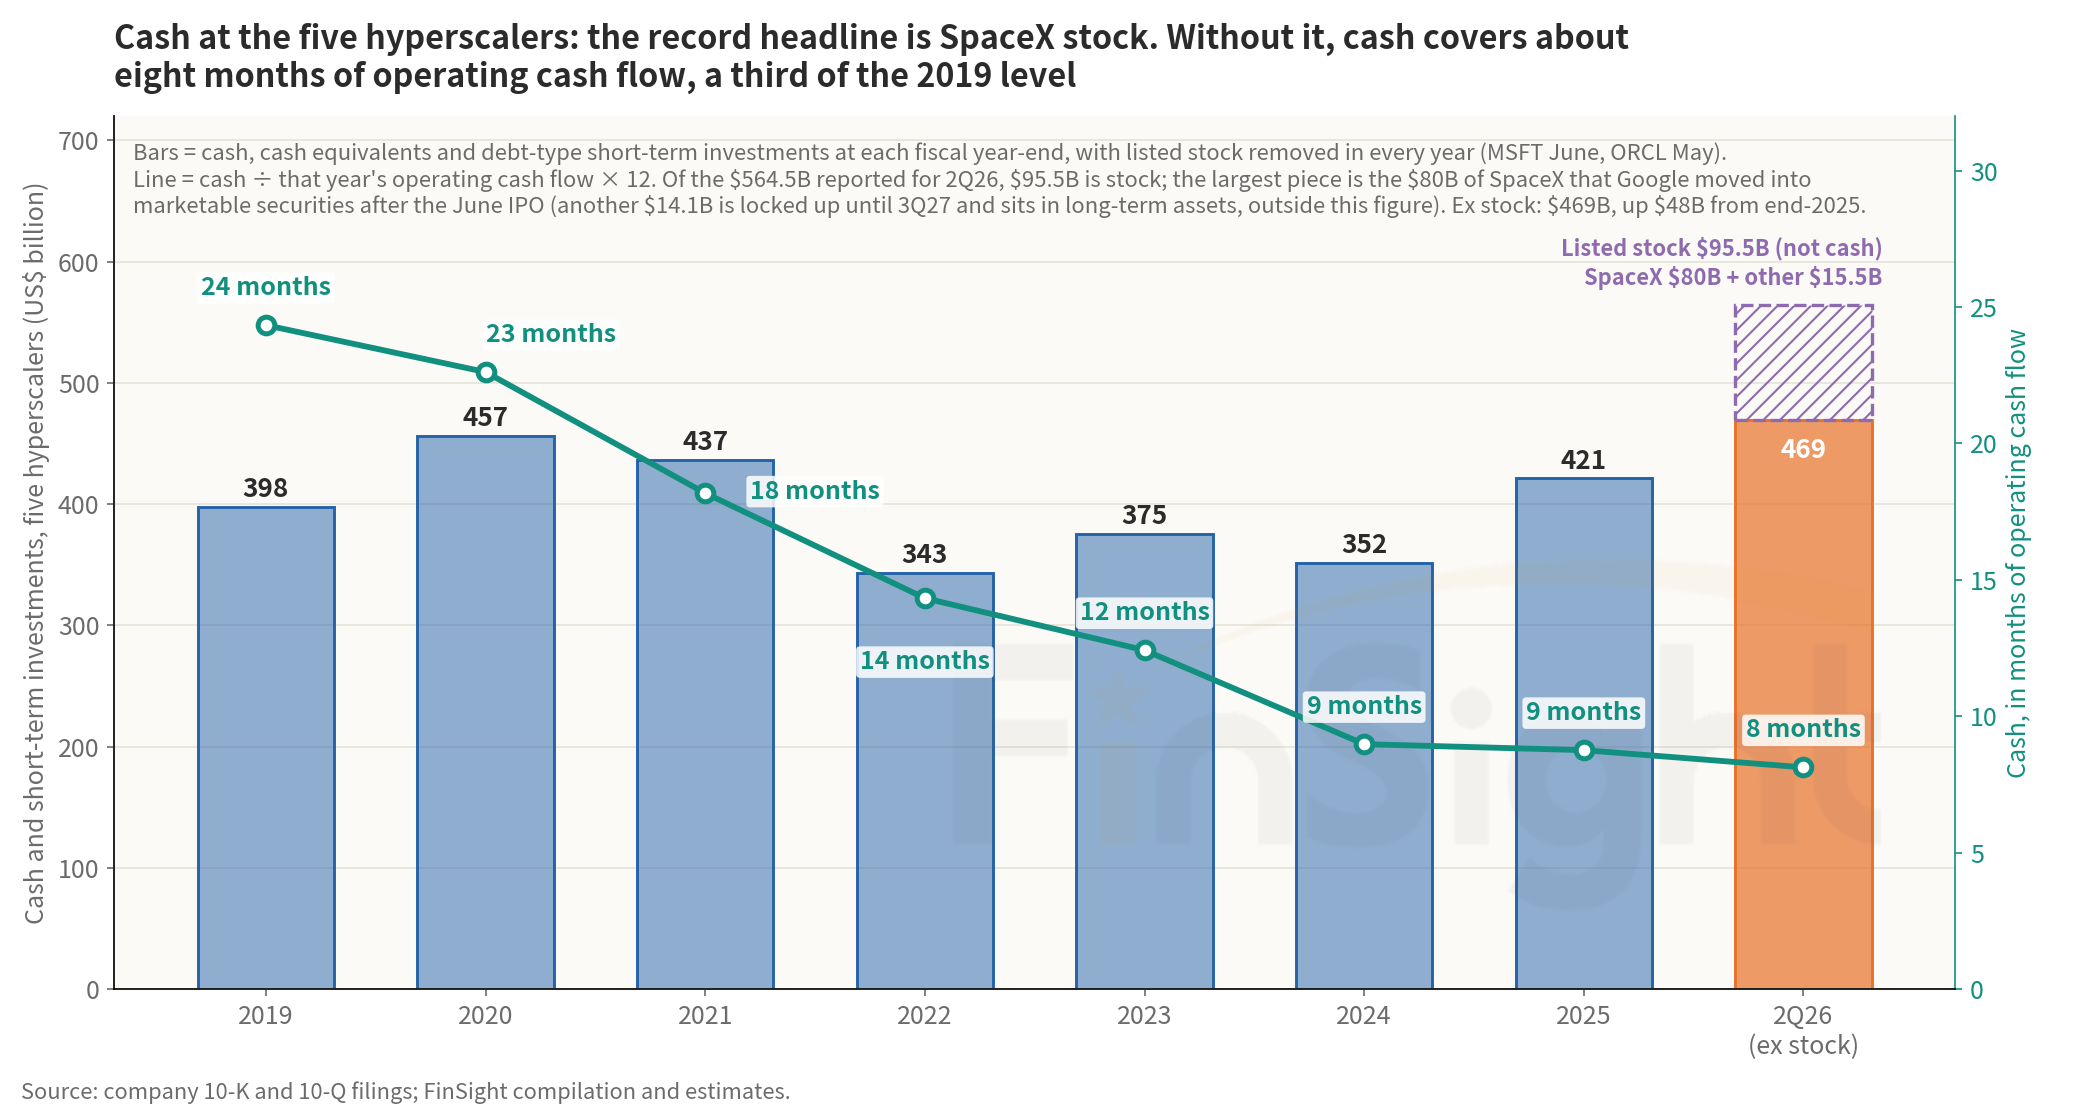
- Cash on hand: cash and short-term investments at the five totaled $564.5B in the second quarter. Take out the $95.5B of publicly traded stock included in that figure (the largest piece is $80B of Google's stake in newly listed SpaceX) and the real number is $469B, only $48B more than at the end of 2025. As noted above, most of the $219B of bonds issued through mid-August went to cover the roughly $135B by which this year's capex plus buybacks ran ahead of operating cash flow. Shareholder payouts are a separate lever. Google and Meta have already all but paused buybacks this year, and if all five redirected the roughly $91B they still pay out in buybacks and dividends, that money would be available too.
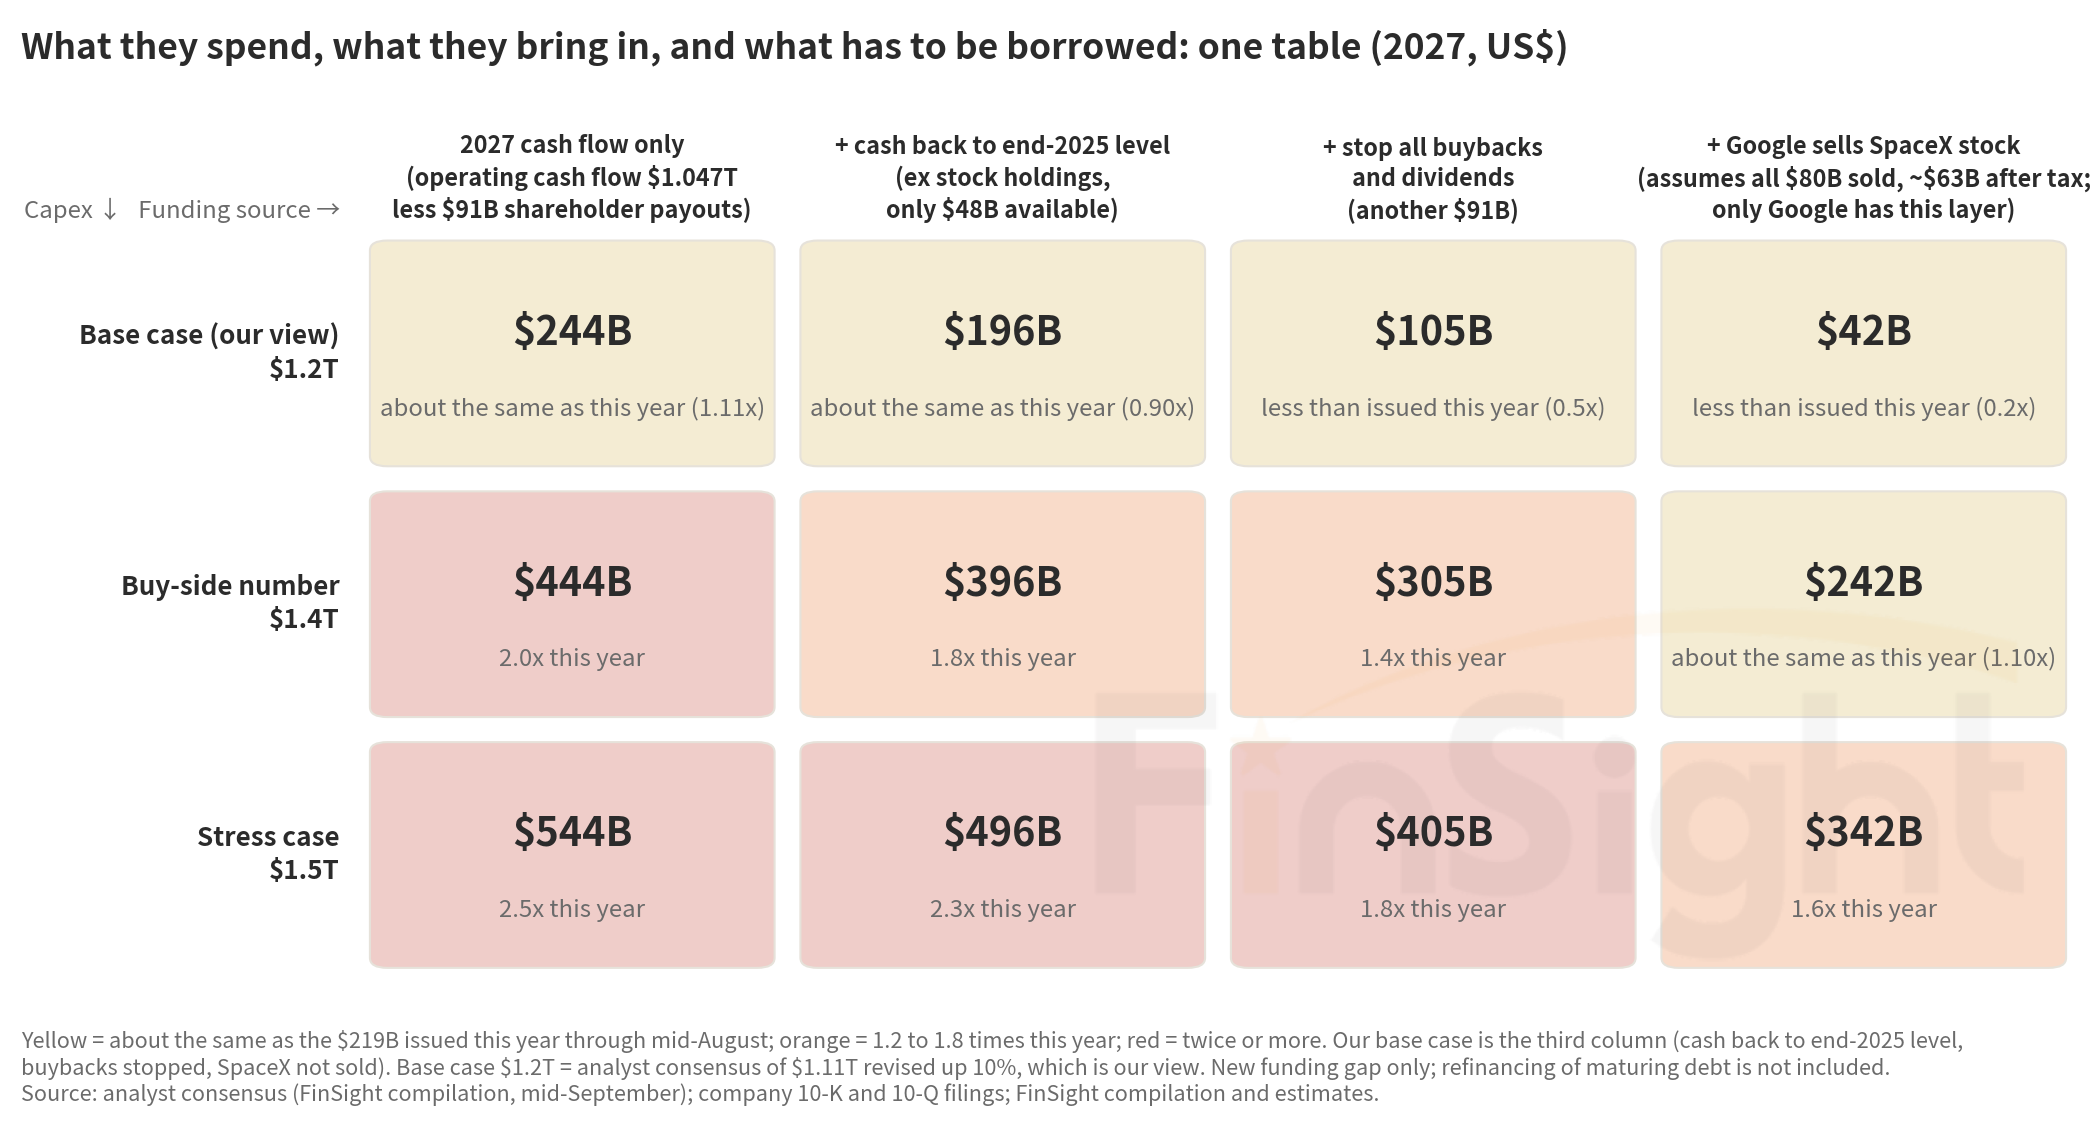
Figure 2 crosses the three capex cases with four sources of funding, added one at a time: next year's cash flow, cash on hand, shareholder payouts, and Google's SpaceX stake. Each cell shows what still has to be borrowed.
First pass: 2027 cash flow only
The strictest way to count leaves all existing cash untouched and pays only out of 2027 cash flow. At $1.2T of capex the gap is $244B; at $1.4T it is $444B; at $1.5T it is $544B. When investors worry that these companies will have to borrow twice as much as this year, this $1.4T cell is the number they have in mind.
Second pass: add cash on hand and shareholder payouts (there is less cash than you might think)
If cash falls back to its end-2025 level, $48B becomes available. Redirecting the $91B of buybacks and dividends as well brings the three numbers to $105B, $305B and $405B. At $1.2T of capex that is only half of this year's borrowing; at $1.4T, 1.4 times; at $1.5T, close to double.
Google's SpaceX stock is the last source. If it sold the full $80B it is free to sell (another $14.1B is locked up until the third quarter of 2027 and is not counted as a funding source here), netting about $63B after tax, the $1.4T case would drop to $242B, about the same as this year. Whether to sell is Google's call, so we show it separately in the far right column of Figure 2 and leave it out of our base case.
One more adjustment: if capex comes in higher, cash flow will too
Figures 2 and 3 hold cash flow at the analyst estimate of $1.047T. But capex reaches $1.4T only if demand turns out stronger than now expected, and in that case cash flow would not sit still either.
In 2024 and 2025, operating cash flow at the big four grew at roughly 40% to 50% of the pace of capex. We assume that holds. Capex of $1.4T would be 26% above analyst consensus, so operating cash flow should land about 10% above the current estimate. That cuts the borrowing to $200B, slightly less than what has already been issued this year.
In the chart below, the horizontal axis is how far next year's operating cash flow lands above or below the estimate. The vertical axis is how much still has to be borrowed after the companies use up their own money (without selling SpaceX). The dotted line is the $219B already issued this year, and the green star marks our view: cash flow comes in above the estimate, for reasons we get to in Question 3.
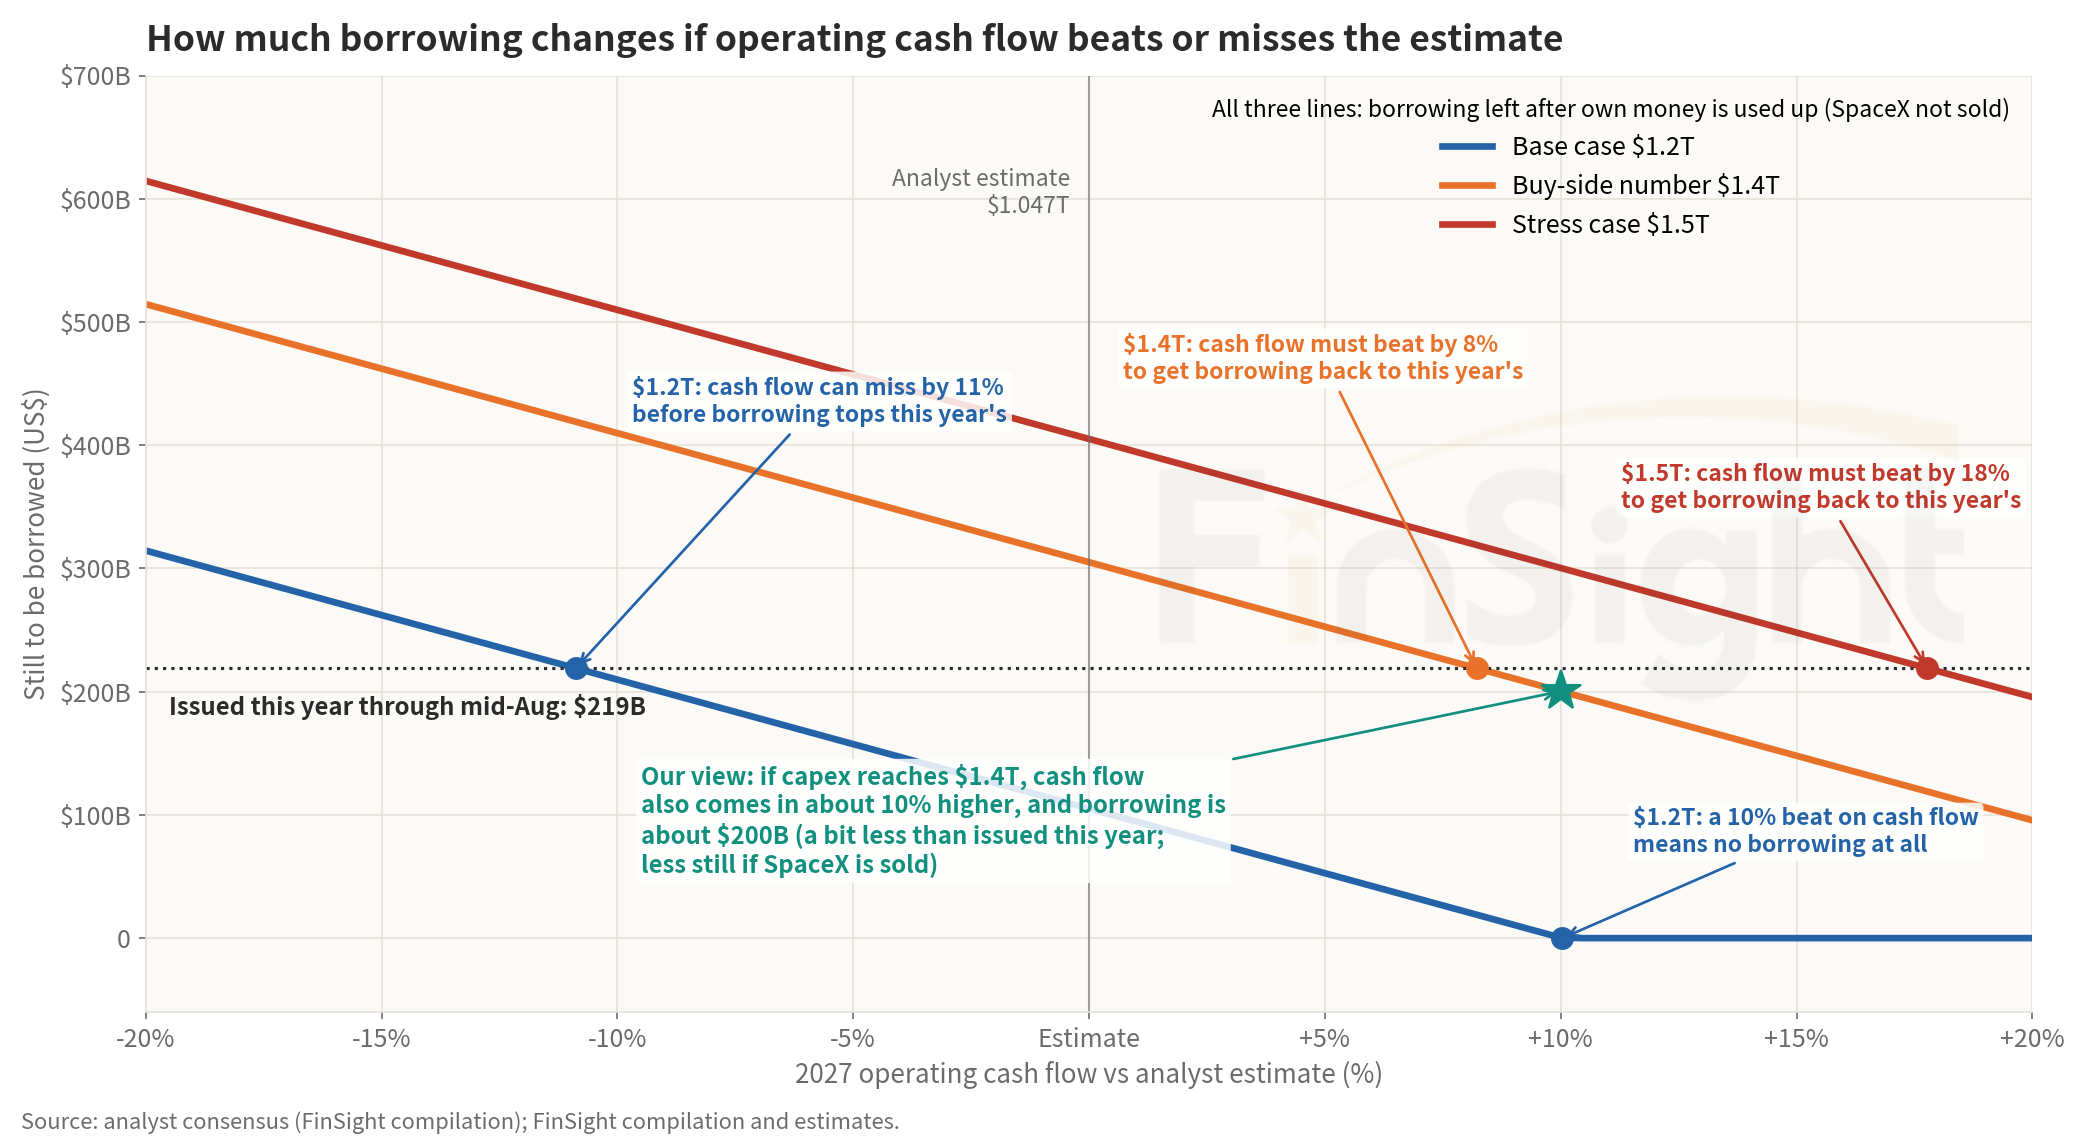
We ran it the other way too. At $1.2T of capex, operating cash flow could come in 11% below the estimate and borrowing still would not exceed this year's. At $1.4T, cash flow has to beat the estimate by 8% to bring borrowing back to this year's level; at $1.5T, by 18%.
How much cash is reasonable?
In the second pass we let cash fall only to its end-2025 level because, measured against how fast these companies generate cash, the five hyperscalers hold less than at any point in seven years. In 2019 their cash equaled two years of operating cash flow. In 2024 and 2025 it was only nine months, and now it is about eight. The cash is also lopsided: Google alone holds $155B of the $469B, and Microsoft's strength is its operating cash flow more than its cash pile. That is why we consider this assumption fairly conservative.
Question 2: Will the market lend it?
The borrowing is manageable in every case, and lower still if Google is willing to sell SpaceX. Now the market's side: are there buyers, how much more does the money cost, and how much room is there before credit ratings come under pressure?
Are there buyers? Order books thinned in July, recovered in August, and one September deal slipped again
The coverage line in Figure 1 hit its low in July. In August Google sold $25B of bonds against $115B of orders, 4.6 times the deal size, back to where deals stood at the start of the year.
The bigger development that month: the largest issuers began moving bond issuance onto a regular schedule. Google, for one, said it will come to market twice a year from now on.
A regular issuance calendar tells investors when next year's bonds are coming and roughly how big they will be, so investors can set money aside in advance and no single deal looks like a scramble for cash.
Amazon is the counterexample. In July Amazon told its underwriters it had no further bond plans. By September it was selling its first bond in British pounds, £4.25B (about $5.8B), with orders for only 2.5 times the deal, weaker than Google's pound deal earlier this year. The size is small, but investors will trust "no further bond plans" less next time. Of the demand signals, it is the only one that moved the wrong way.
Price: the money is there, but every deal costs a bit more
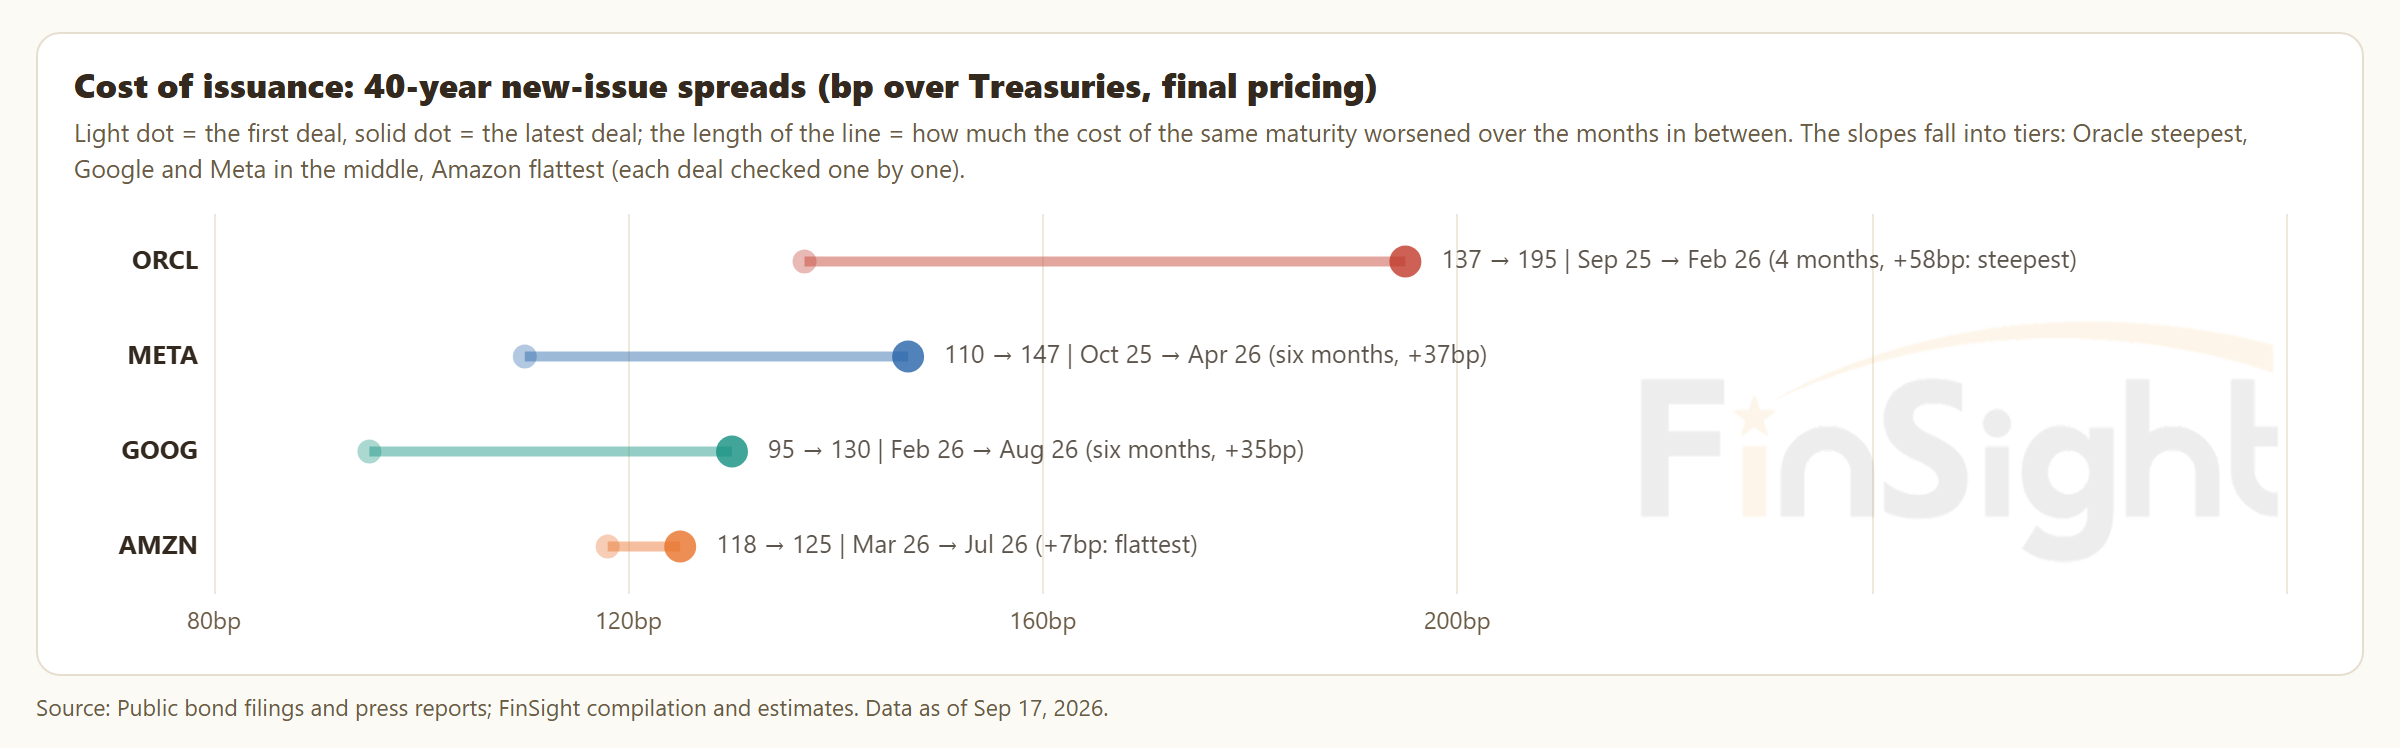
To get a new bond sold, a company has to offer a slightly better yield than its existing bonds pay. That sweetener, the new-issue concession, was about 4 basis points (0.04 percentage points) at the start of the year. On the longest-dated bond in Amazon's July deal it was 20 basis points (0.2 percentage points). The spread, meaning the extra yield a corporate bond pays over Treasuries, has also widened steadily on 40-year bonds over the past six months. Lenders are still lending. They just charge a little more each time.
The 30-year Treasury yield hit 5.37% on September 10, the highest since 2007, and it is often cited as proof that bond buyers are tapped out. We don't read it that way. Most of the rise in yields from mid-August to mid-September came from investors asking for more compensation to hold long bonds, which is a long way from a buyers' strike. The September 10 auction cleared at that high yield, and investors still bid for 2.6 times the amount on offer. And when the Fed raised rates by a quarter point on September 16, the 30-year yield fell that day. The hike was already priced in.
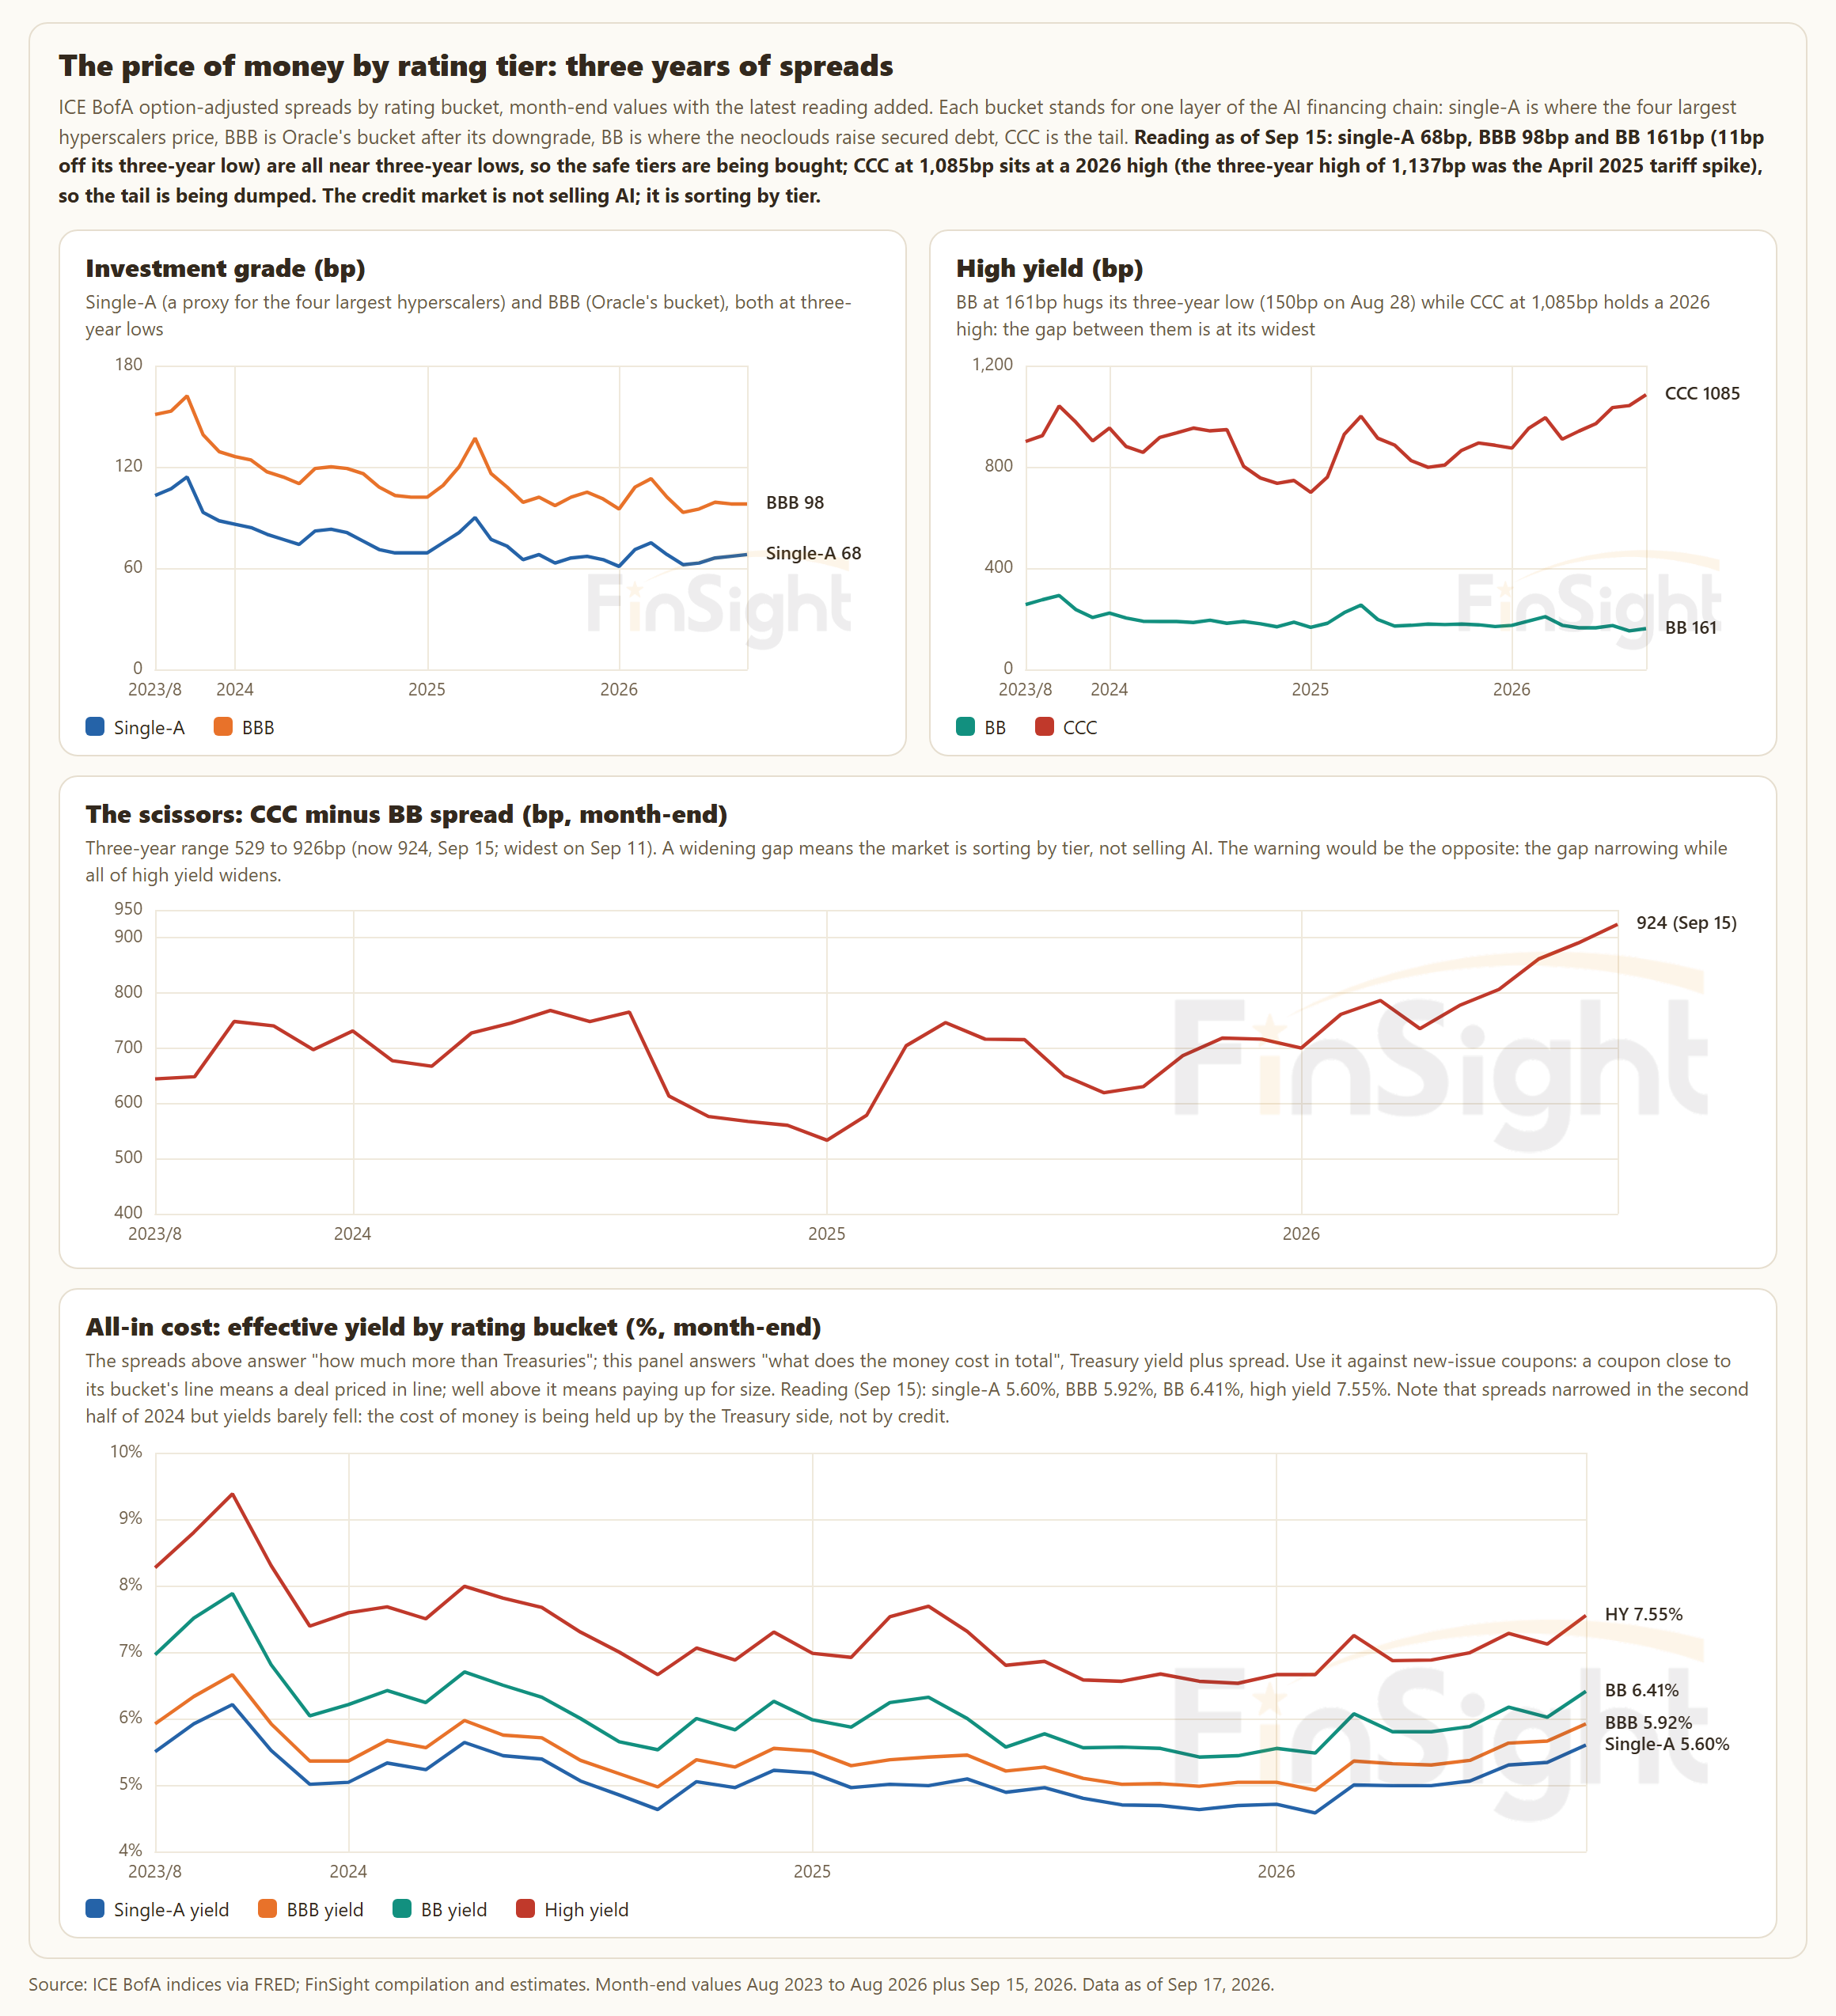
Spreads by credit rating tell the same story. Single-A, the usual reference point, is at 68 basis points (0.68 percentage points), and the big four are rated higher than that. BBB, where Oracle sits, is at 98 basis points (0.98 percentage points). Both are close to three-year lows. Only CCC, the weakest tier, is near a three-year high at 1,085 basis points (10.85 percentage points).
Investors are being choosy. Strong credits still borrow easily, at spreads near three-year lows, and weak ones are paying more every month.
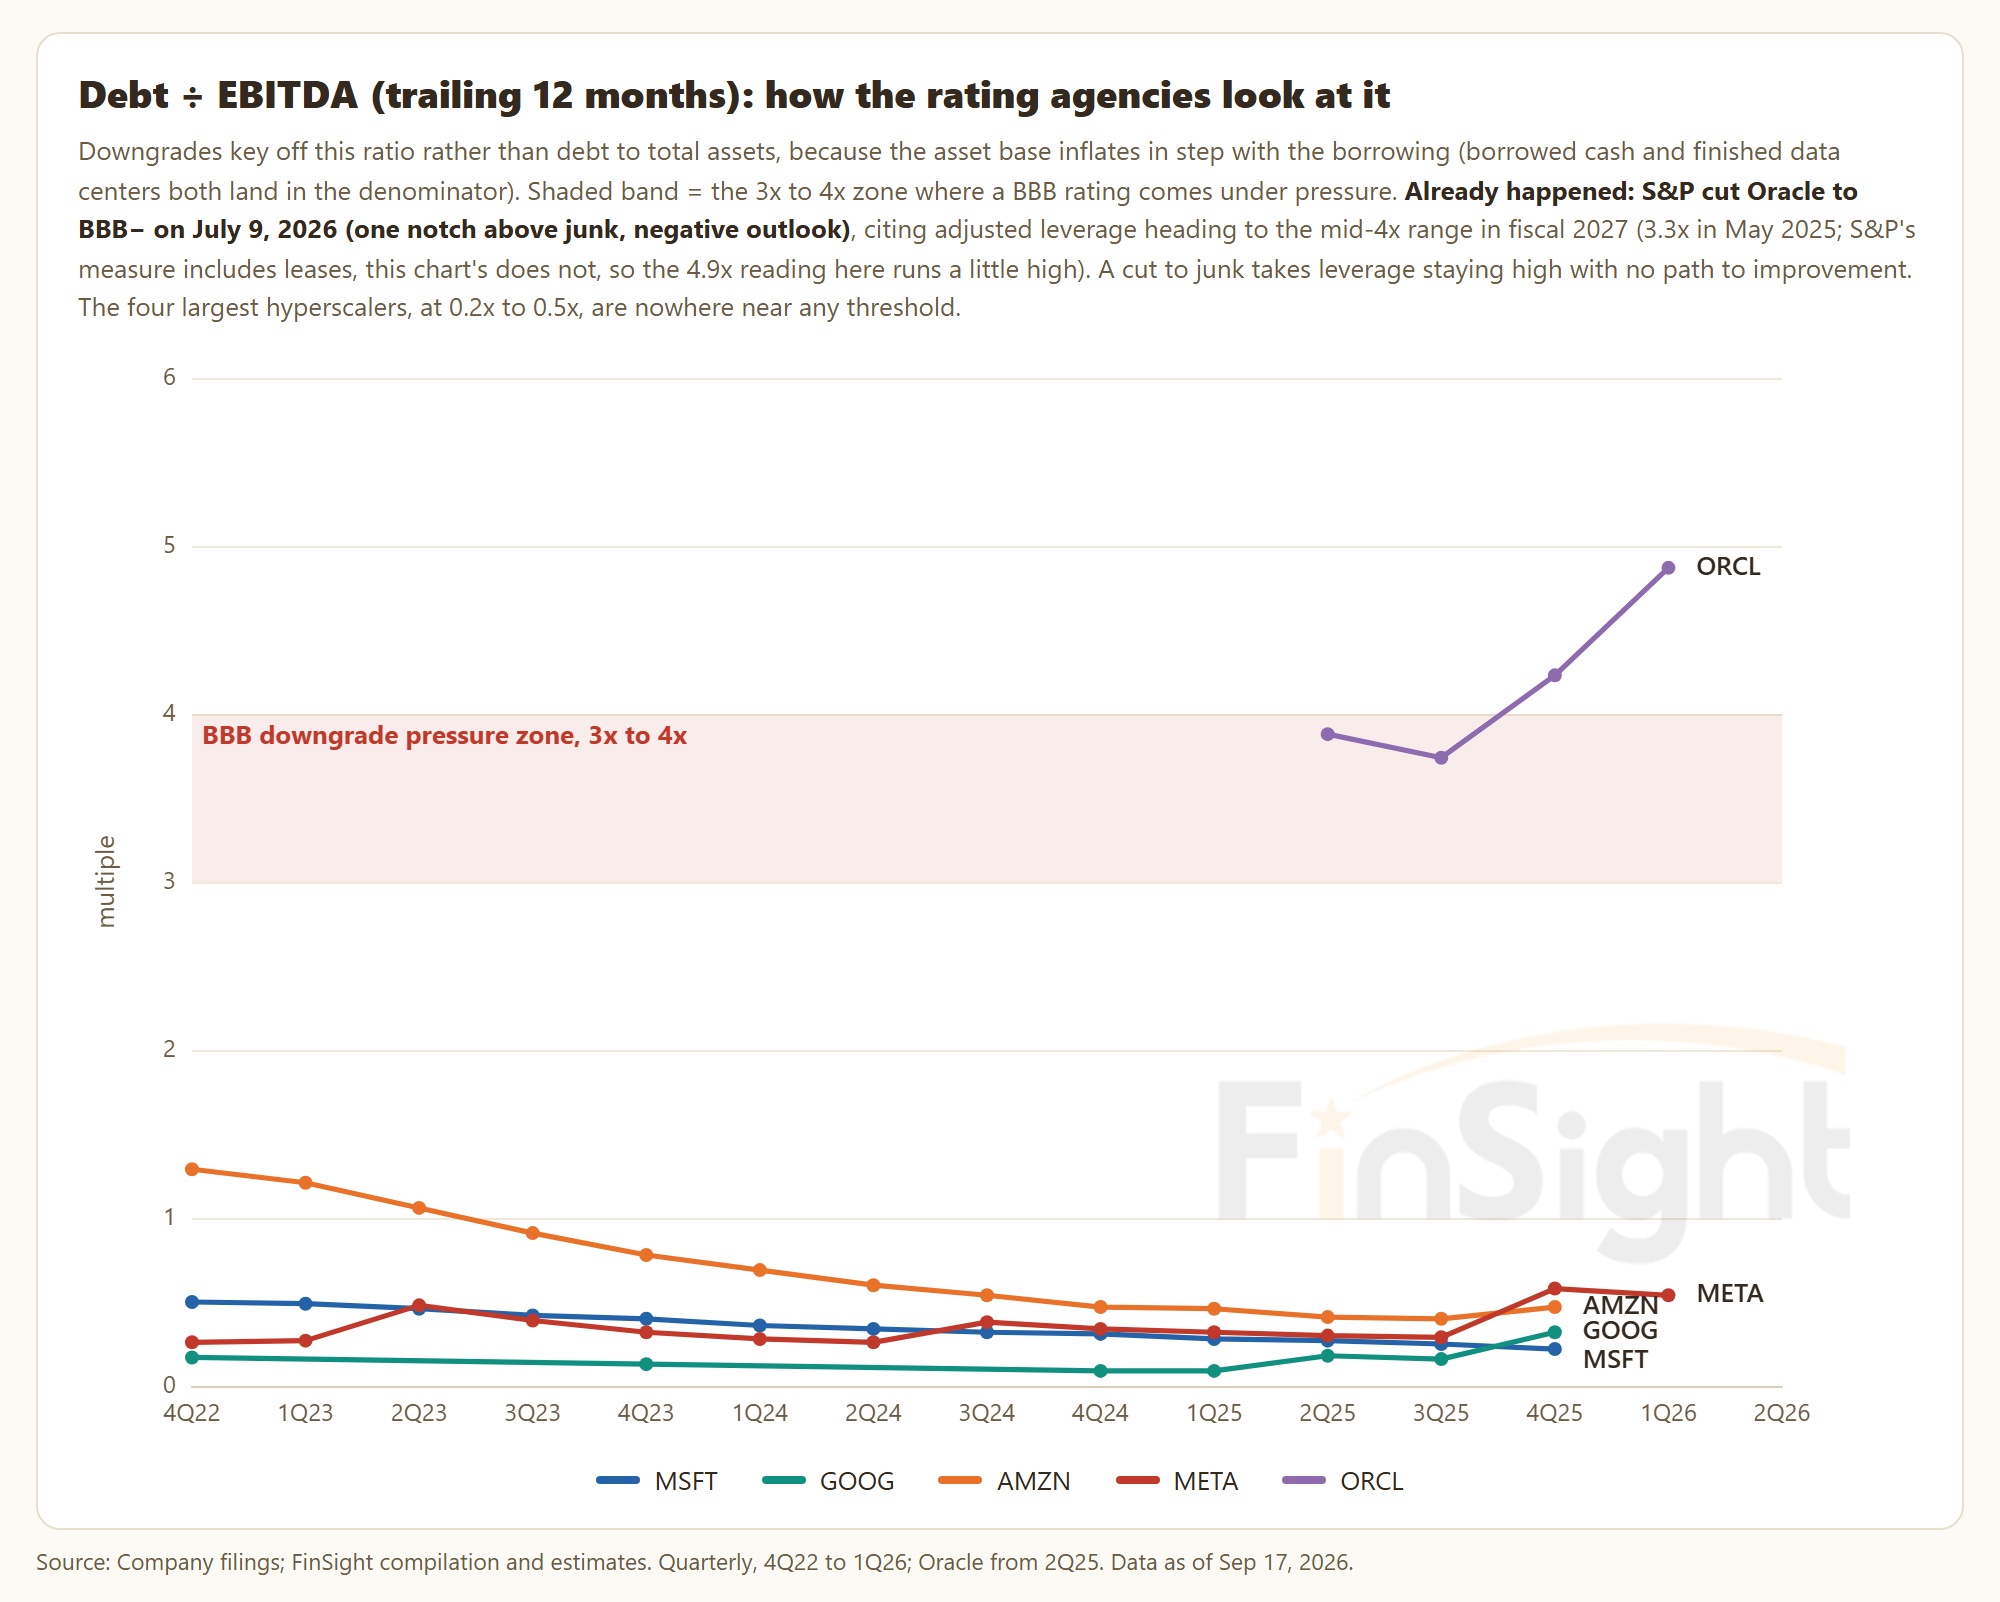
Ratings: under our assumed ceiling of 1.5 times, the big four have room for another $880B
Rating agencies judge leverage as debt divided by EBITDA, a rough measure of yearly cash earnings before interest, taxes and depreciation. At the big four that ratio has been falling for years and now stands at just 0.2 to 0.6 times (on the past twelve months of EBITDA, leases not included). For all five, with leases included and measured against next year's estimated EBITDA, it is only 0.73 times, lower than in any year from 2019 to 2022.
| Company | 2027E EBITDA | Debt (incl. leases) | Leverage (debt ÷ 2027E EBITDA) | Room to borrow before 1.5x |
|---|---|---|---|---|
| Microsoft | 261.0 | 128.8 | 0.49x | 262.7 |
| Google (Alphabet) | 300.5 | 118.8 | 0.40x | 331.9 |
| Amazon | 278.6 | 243.1 | 0.87x | 174.8 |
| Meta | 148.7 | 112.3 | 0.76x | 110.7 |
| Oracle | 63.7 | 169.1 | 2.65x | -73.5 (already over the line) |
| Five combined | 1,052.5 | 772.1 | 0.73x | 806.7 |
The 1.5 times ceiling (debt equal to a year and a half of EBITDA) is our own reference line. It is not a threshold published by the rating agencies.
Source: Analyst consensus (FinSight compilation), estimates as of mid-September; Oracle debt is from its report for the quarter ended August 31 (borrowings of $125.3B plus operating leases of $34.6B and finance leases of $9.2B); FinSight compilation and estimates
Leaving Oracle out, the big four could borrow another $880B before reaching that line (the table's $806.7B total nets out Oracle's shortfall). That is 60% more than the $544B in the harshest case in Question 1, which was $1.5T of capex funded only from next year's cash flow. Even if they do spend $1.4T in 2027, raise that by another 25% the year after, and fund the whole gap with bonds, leverage at the five would reach about 1.5 times by the end of 2028, right at the line. (No company would actually do this. They would adjust along the way based on how fast the money is coming in and how much cash they have.)
The one name over the line is Oracle. Its leverage is already 2.65 times, half of its contract backlog comes from a single customer, and in July S&P cut its credit rating to one notch above junk. Still, Oracle's September 10 earnings report was better than the table implies: Oracle finished its $20B stock sale, its borrowings went down, and in most newly signed contracts the customer either prepays or supplies its own hardware. This quarter Oracle funded itself with equity and prepayments instead of more debt.
Question 3: What is the more expensive money buying? Debt at 5% to 7% is funding servers that pay back in two years
The big four are now borrowing at yields of roughly 5% to 7%, depending on maturity: close to 5% at three to five years, and 6% to 7% at thirty years and beyond. When Google began marketing its 40-year bond in August, the first spread floated to investors (initial price talk) was about 155 basis points (1.55 percentage points) over Treasuries.
The cloud companies have said publicly how fast the servers bought with this money pay for themselves. On Amazon's second-quarter earnings call, management said AWS servers pay back in under three years and can be used for five to six. In early September, Google Cloud's CEO told a Goldman Sachs conference that AI servers overall pay back in under two years, that the payback period on Google's own AI chips, called TPUs, is only half that of GPUs, and that most of the contract value is in long five-year deals.
So the equipment pays for itself in two years and the contract keeps earning for three more. Our own estimate points the same way. In our July 22 post on the cost of AI compute we projected that annualized revenue per chip reaches the breakeven line, the point where buying one more chip makes money, by the middle of next year.
Put the two side by side. Equipment that earns back its full cost in two years is returning many times the 5% to 7% a year the money costs. The landlords, meaning the data center owners and newer GPU cloud providers that rent out capacity, pay more, up to 10%. With a gap that wide, an extra percentage point or two of interest matters very little to this business.
This is also why we were willing to put the green star in Figure 4 on the right side of the chart, where cash flow beats estimates. With payback this fast, revenue should show up sooner than the numbers analysts have penciled in today, and next year's operating cash flow has a chance of beating estimates.
The financing structure is neutral. What matters is whether AI earns the money back
Big technology shifts play out over decades, and somewhere along the way companies overbuild, which creates cycles around the long-term trend. This one will be no different.
What makes people nervous this time is how the money moves. Suppliers invest in their customers, and the customers turn around and sign contracts with them: Nvidia invests in OpenAI, OpenAI signs with Oracle, Oracle buys chips from Nvidia, and the money goes around in a circle. To many people that looks like a bubble.
We think the financing structure is neutral on its own. If AI revenue comes through, this structure is the virtuous cycle the companies are counting on. If AI sales disappoint, it becomes the vicious cycle the market fears: spending cuts, lower supply chain estimates, slipping credit ratings.
Which way it goes depends on whether end customers are actually paying: whether the cash coming from enterprise subscriptions, consumers, API usage and advertisers keeps growing, and whether it grows faster than the contracts AI companies sign with each other.
We draw it as two loops, where the links on one side mirror the links on the other:
On the left, the virtuous cycle: real customers pay, signed contracts turn into revenue, the investment earns more than the debt costs, internally generated cash covers spending, companies borrow less, ratings hold and borrowing costs come down, they reinvest, and there is more compute.
On the right, the vicious cycle: real customers stop paying, signed contracts don't turn into revenue, the investment earns less than the debt costs, companies borrow more at higher rates, ratings get cut and spending follows, and the landlords and the supply chain feel the pain first.
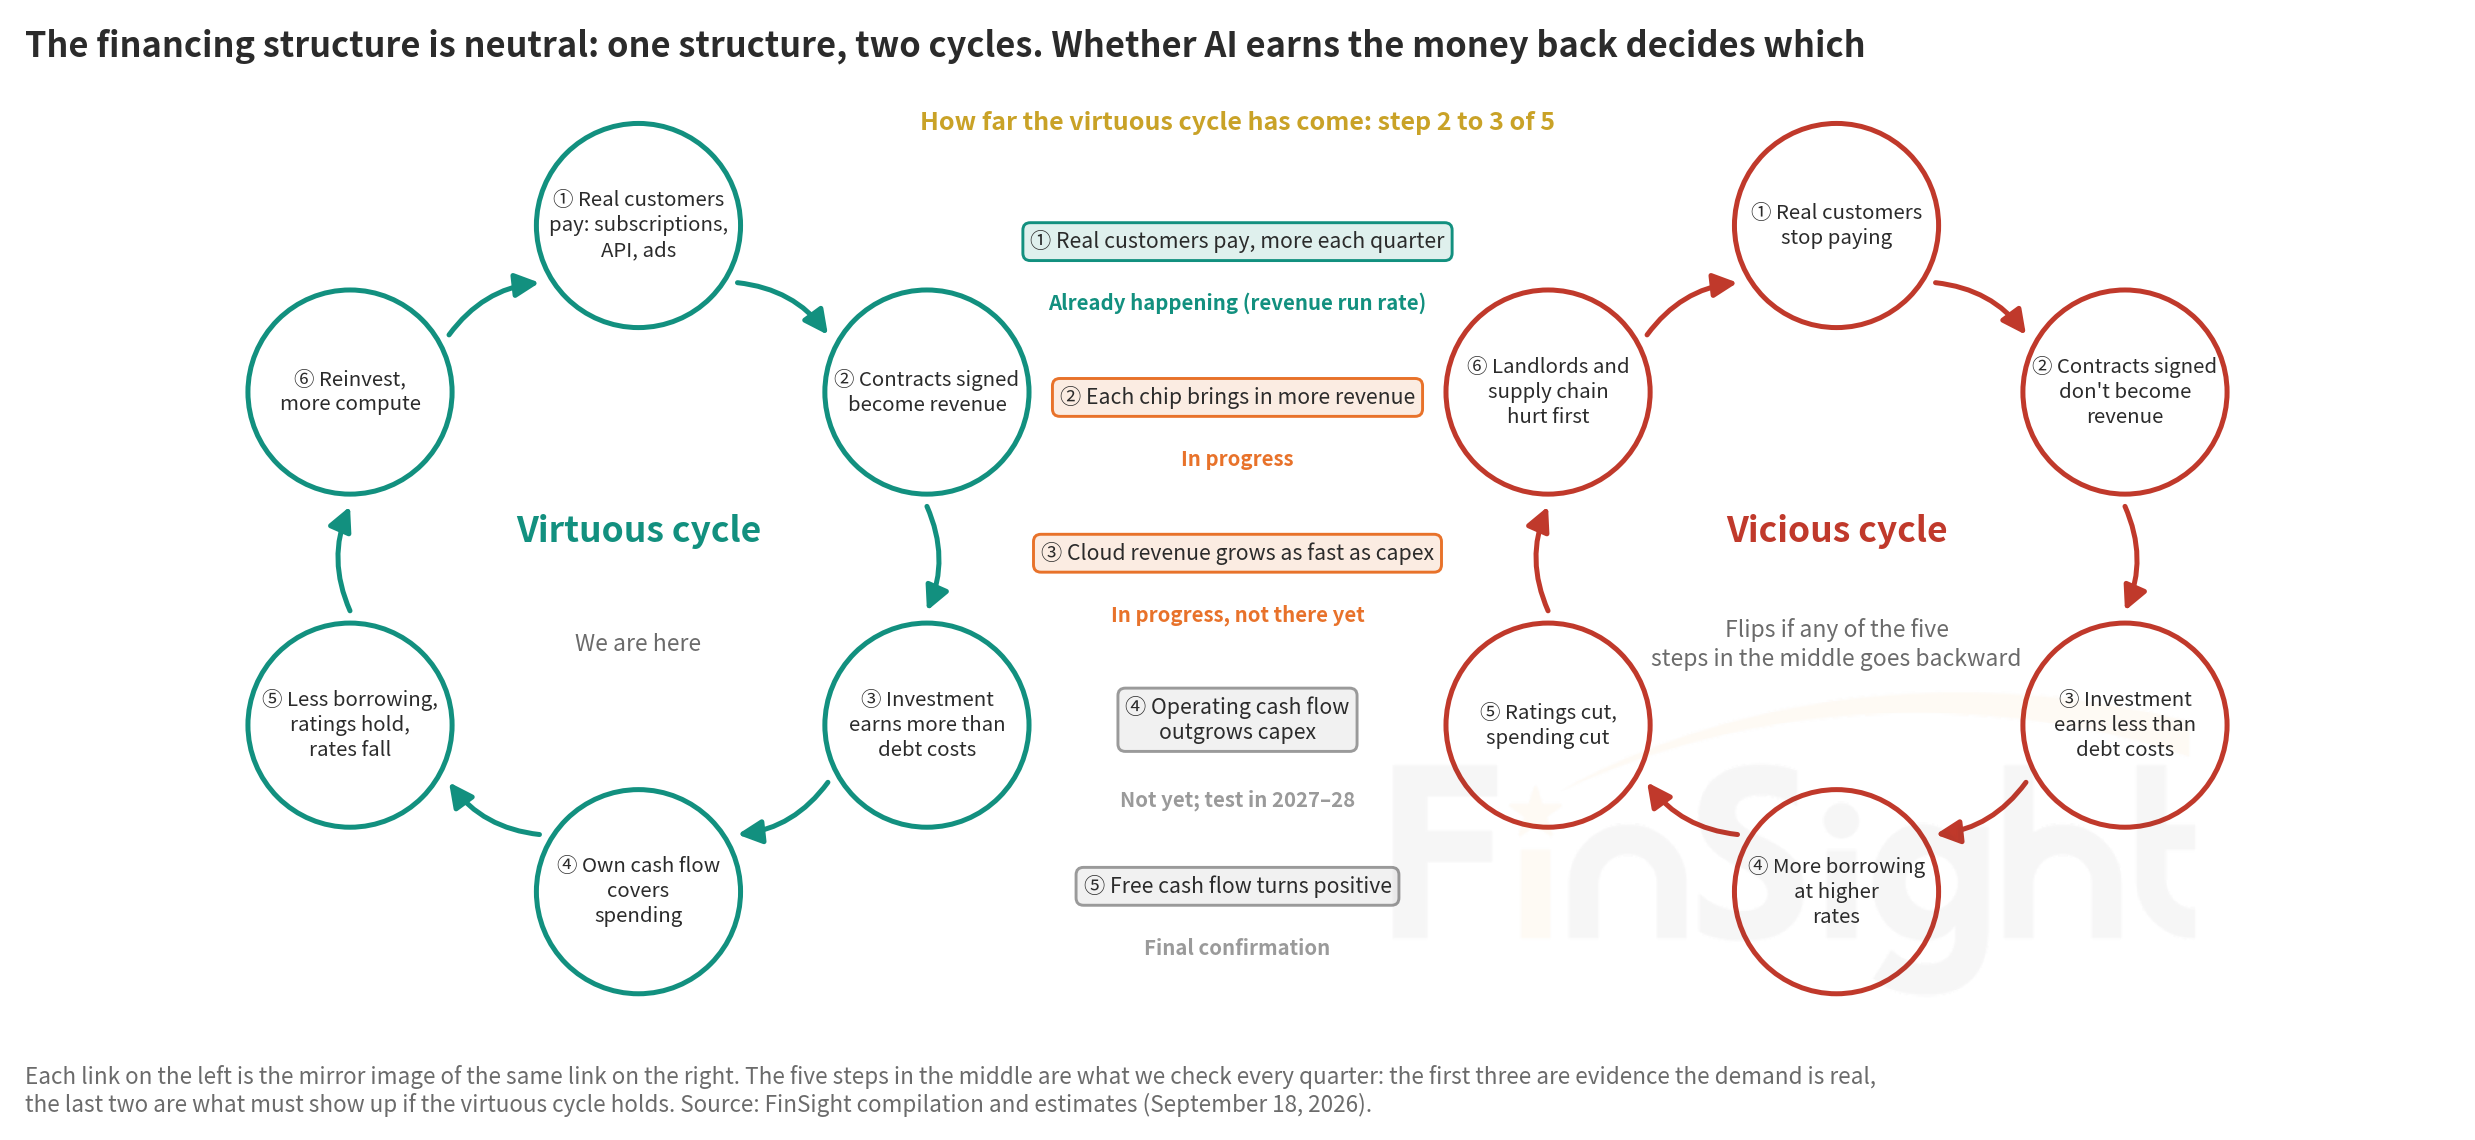
By our math, next year's borrowing is not much to worry about. What to watch from here is whether AI earns the money back.
We break the virtuous cycle into five steps that follow the money downstream: customers pay, each chip earns more, cloud revenue grows with capex, operating cash flow outgrows capex, and free cash flow turns positive. Each step can be checked against public numbers. Right now we are at steps two and three:
- Real customers keep paying, and each quarter adds more than the last. Already happening. Measured by revenue run rate (the latest month's revenue times twelve), AI companies such as OpenAI and Anthropic were bringing in a combined $73B or so a year in the second quarter and are already around $108B in the third. That is more than $30B added in one quarter, more than was added in all of last year.
- Each chip is bringing in more revenue and closing in on the breakeven line. In progress. Divide that revenue by the compute in service (counted in H100-class chips) and you get annualized revenue per chip of about $2,430, counting AI companies' revenue only. That is up 84% in two quarters and roughly half of the $4,500 breakeven line from our July 22 post. The cost of building compute is fixed, so the investment only pays if this number keeps climbing.
- Cloud companies' own revenue grows as fast as their capex. In progress, not there yet. Google Cloud grew 82% year over year in the second quarter, while Google's capex doubled. Cloud's share of total company revenue is rising by about 1 percentage point a quarter, and the higher that share, the more cloud drives the whole company's cash flow growth.
- Operating cash flow grows faster than capex. Has not happened yet; the test comes in 2027 and 2028. On analyst estimates, operating cash flow and capex at the five hyperscalers both rise close to 40% in 2027, a tie. In 2028 cash flow rises about 10% and capex about 26%, so cash flow still isn't catching up. To catch up, operating cash flow has to beat consensus, which is exactly the bet behind our green star in Figure 4.
- Free cash flow turns positive. Not yet. The final confirmation is the quarter these companies stop borrowing to invest and start throwing off cash again. If this step arrives, most of the worry about debt should go away.
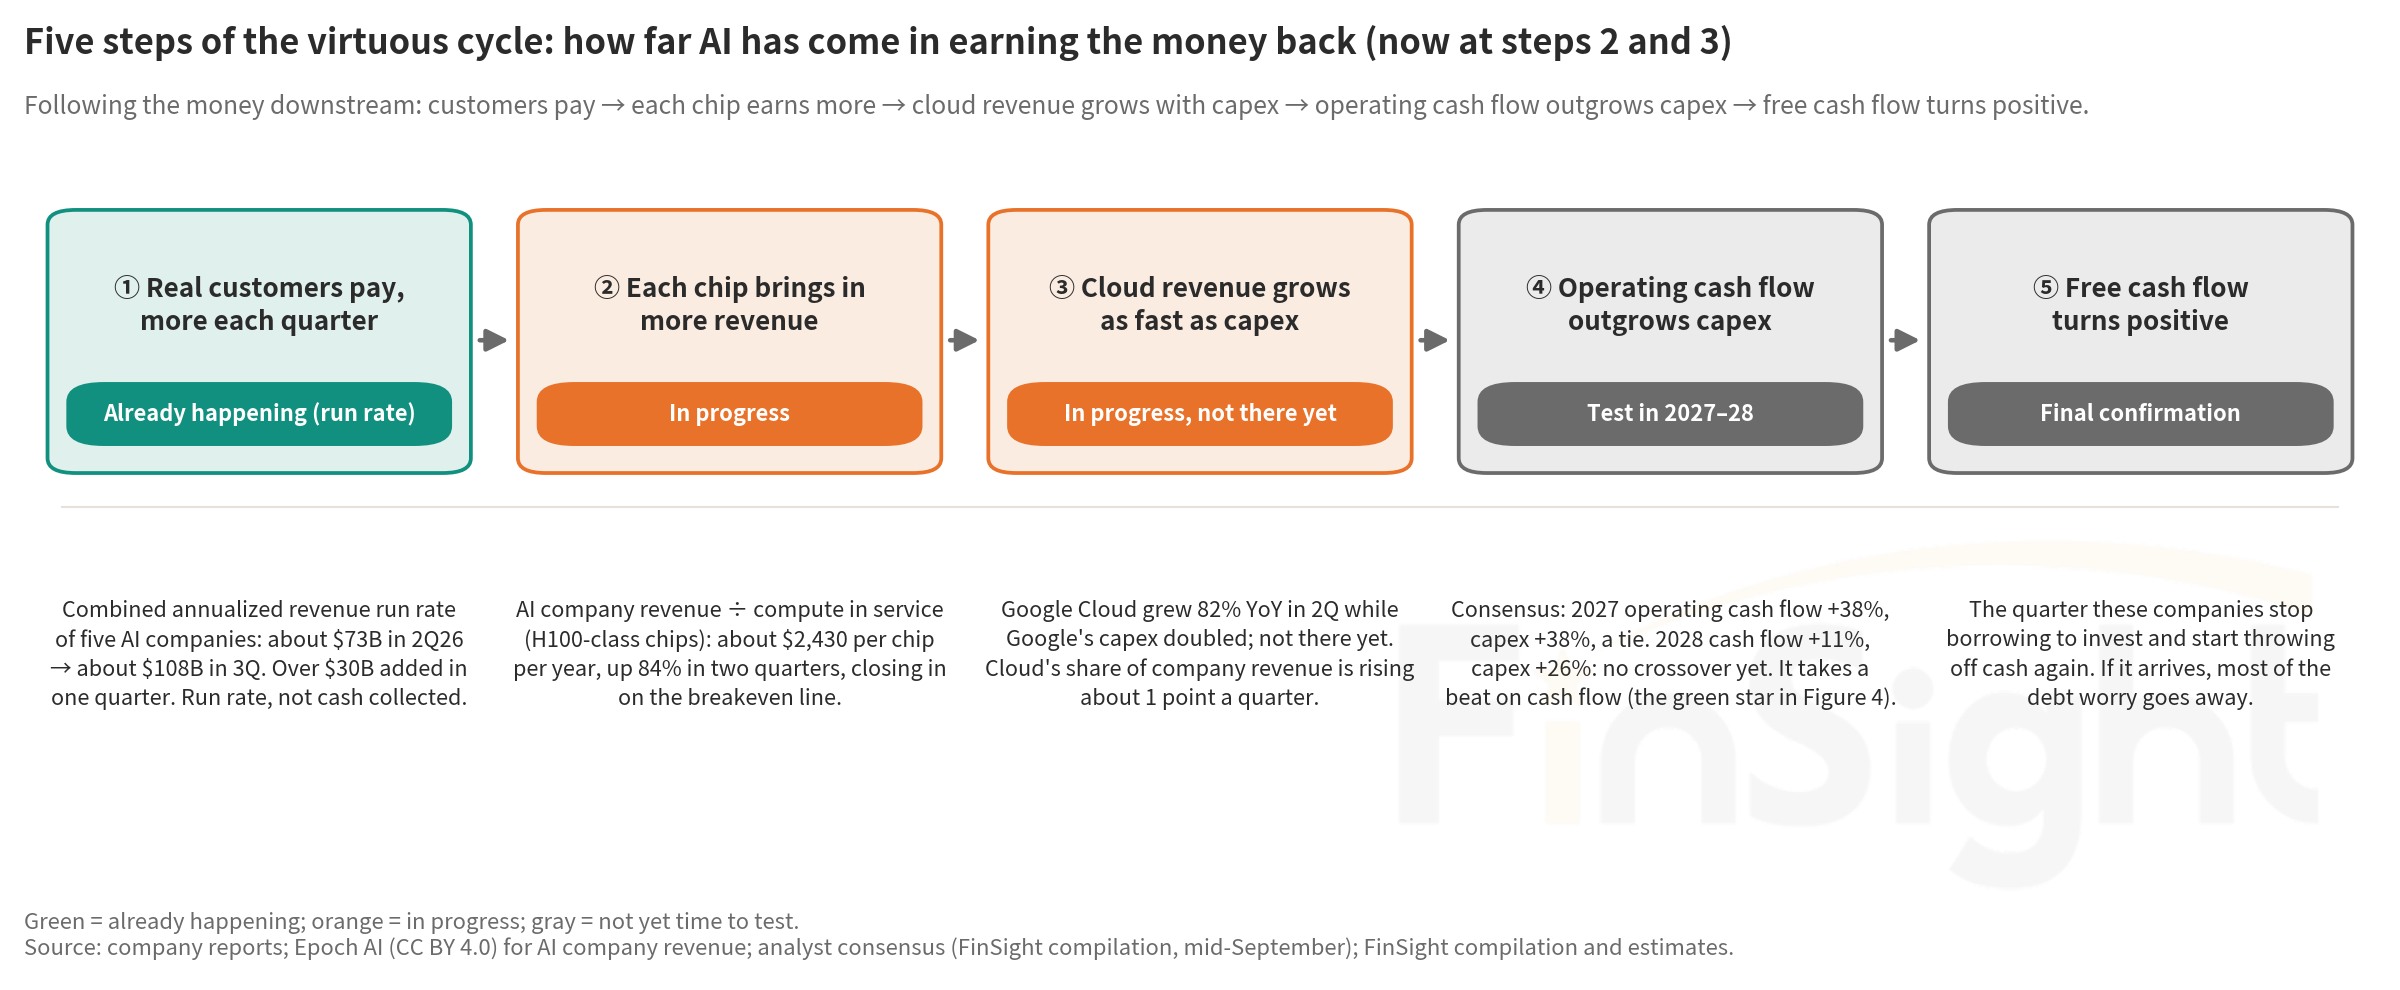
The market's worry rests on the premise that the demand isn't real, and these five steps are how we test that. The first step is confirmed and the next two are moving the right way. If the last two fail to show up on schedule, or any earlier step goes backward, that is the time to start treating the vicious cycle as the base case.
All of these numbers are on our dashboard and we check them every quarter. We will flag any revisions.
In the next post we work through the vicious cycle in detail: if demand disappoints, who is left holding the spending that is already under contract and can't be cut?