US enterprise paid AI adoption went from 8% in 2022 to 42% in 2025, and Anthropic added $3B of ARR in six months. That is a turning point.
Anthropic added $3B of annualized recurring revenue (ARR) in the first half of 2025, a 300% increase. That is a startling half-year, and it is the single number that best explains why we think the AI story changed this year.
Key takeaways
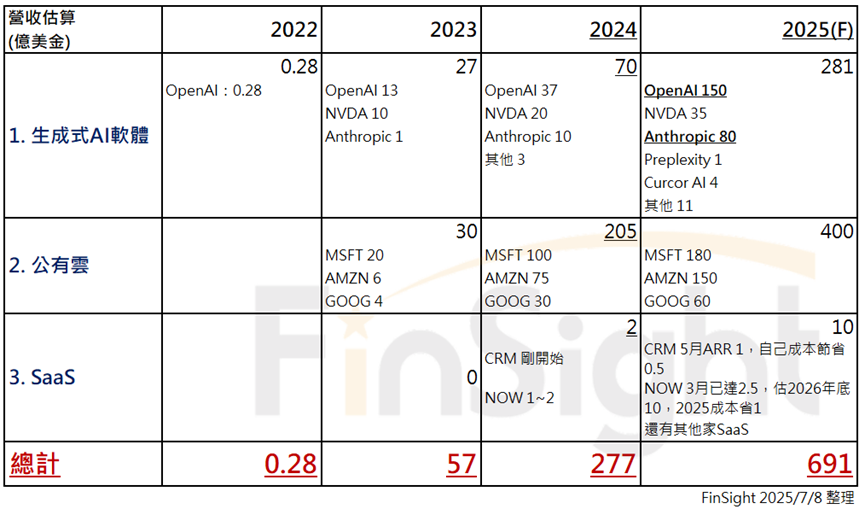
- Anthropic's ARR went from $1B to $4B in six months, up 300%, past the $3.7B bull case it gave in February for the whole of 2025. At this run rate we see it finishing 2025 near $8B.
- OpenAI reached $10B of ARR at the end of June, $4.5B more than the $5.5B it was at in December 2024, up 82%, with paying users up 50% from February to May.
- US enterprise paid adoption of AI went from 8% in 2022 to 42% in 2025, on numbers from the investment firm Coatue. Reasoning models shipped at the end of 2024 are the catalyst that turned AI from a consumer tool into an enterprise productivity tool.
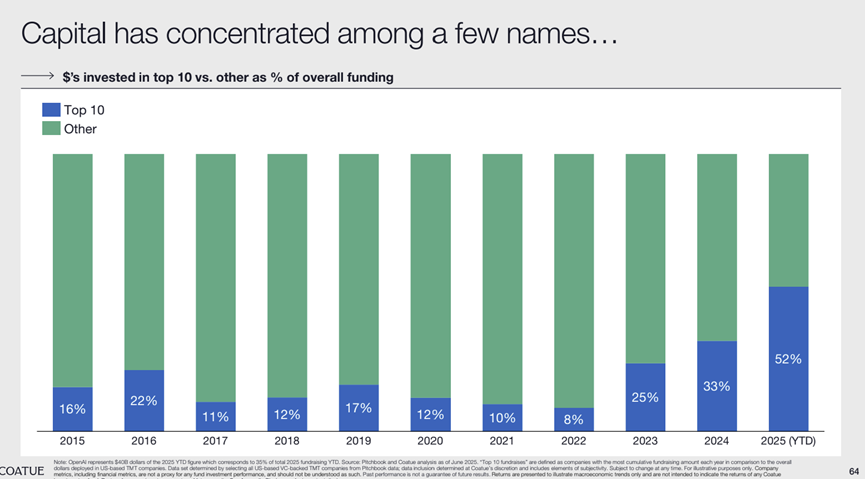
- This is a trend that runs across the cycle, the third paradigm shift this generation has seen after the personal computer in 1975 and the commercial internet in 1995. What is different is concentration: the top 10 companies' share of private investment went from 8% in 2022 to a projected 52% in 2025.
Our June 2025 post, Is AI Capital Spending Justified? An AI Investment Bubble? Let the Data Answer, tested the spending against the data: AI would create more than $100B of value in 2025, against just $86.5B of incremental capital spending (capex) in 2024 from the five largest US cloud companies.
What we are looking at now runs well ahead of that. Second quarter revenue growth at the generative AI vendors, and the speed at which enterprises are adopting these applications, put us in mind of two earlier moments in technology: the birth of the personal computer from 1975 to 1980, and the opening of the internet to commercial use and its spread from 1995 to 2000.
When a disruptive technology moves out of the infrastructure phase and into an application boom, you tend to get a trend that runs across the cycle, meaning capital keeps flowing into the industry that represents the future even when the economy around it is unstable. We think we are standing at one of those historic turning points.
The first half in generative AI: enterprise applications beat expectations, and the estimates are going up
Anthropic's growth ran far ahead of expectations, including its own. The timeline:
- February 2025: full-year guidance of $2.2B in the base case and $3.7B in the bull case.
- March 2025: reached $2B, effectively the full-year base case.
- May 2025: reached $3B of ARR.
- June 2025: reached $4B of ARR, above the bull case for the entire year.
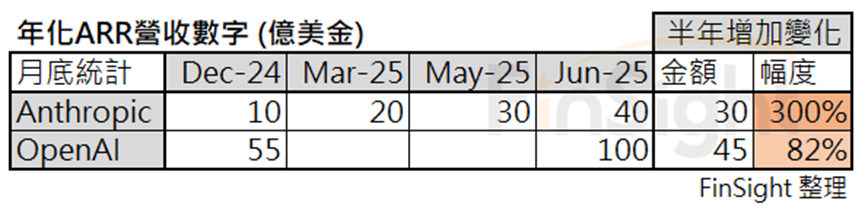
That is $3B of ARR added in six months, a 300% increase, and mostly API: usage billed by token is 75% of revenue. That pace ran past what the market expected and past what the company expected, and the time it takes to add each billion of revenue keeps getting shorter.
OpenAI grew to plan, and hit $10B of ARR at the end of June
- End of December 2024: ARR of $5.5B.
- June 2025: ARR of $10B, $4.5B added in six months, up 82%.
- February to May 2025: paying users up 50%.
OpenAI is still mostly a subscription business, roughly 75% of revenue. Paying users rose 50% from February to May 2025, with the updated image generation in the new version of GPT-4o, released at the end of March, the most visible driver. Subscription numbers went up again with them.
The companies' own revenue forecasts still need a big upward revision
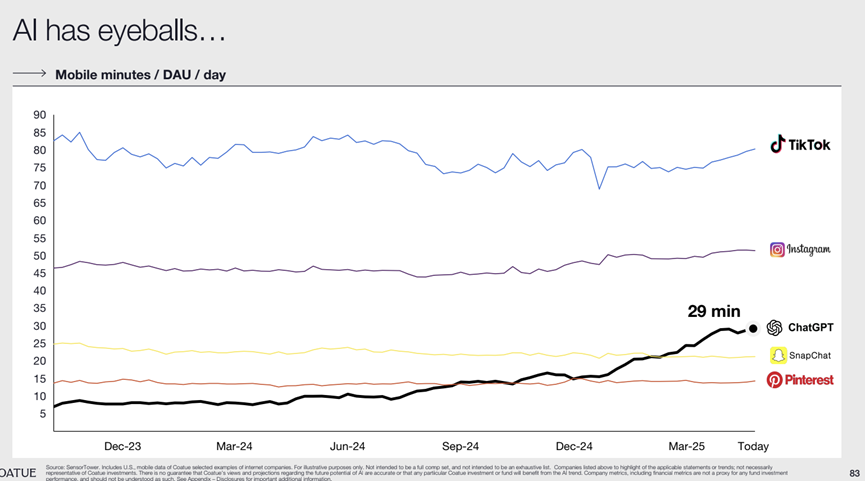
On the latest data, the numbers both companies put out between February and March 2025 are clearly too conservative, and both have to be revised higher.
- Anthropic's estimates need a large upward revision. At the current pace of $4B of ARR, it very likely reaches $8B of ARR by the end of 2025, far above the $3.7B bull case it gave at the time.
- OpenAI is tracking its plan on revenue and running ahead of it on paying users. That 50% growth in paying users says the subscription business is stronger than expected.
- The upward revision is an industry-wide trend. Neither company has updated its long-range revenue outlook in a long time, but on the current growth path, a clear revision higher is close to inevitable.
A long time here means three or four months. Three months in AI is a normal industry's year.
Efficiency gains in B2B are the catalyst, and they bring exponential penetration
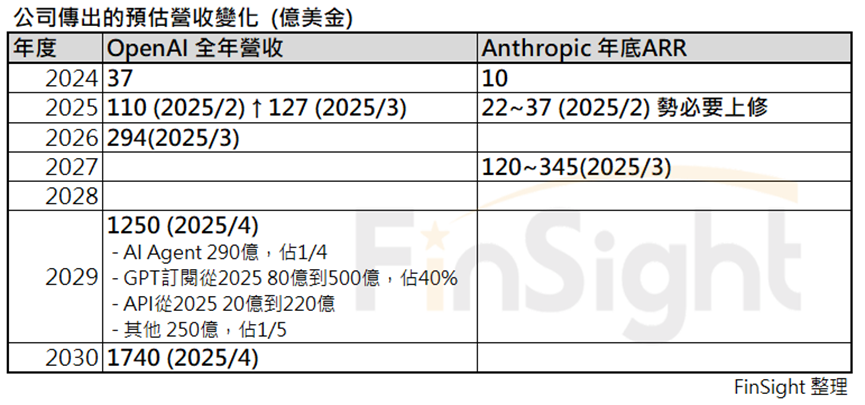
Business to business (B2B) applications have done far better this year than anyone expected, and the logic behind it is simple: once this category proves it makes people more efficient, enterprises adopt it fast and at scale. A note on the definition: we use B2B loosely here to mean workplace productivity spending, whether the company or the employee pays, because a lot of it right now comes out of the employee's own pocket.
The clearest example is what changed once MCP (Model Context Protocol) standardized the plumbing. Over the past few months we have watched one productivity tool after another keep adding AI features, and Anthropic shipped a series of significant updates to Claude in the second quarter of 2025, most of them built around MCP integration. That density of feature iteration is the signal that the B2B market has entered its fast penetration phase.
With the technical foundation in place, the friction in adopting AI tools drops sharply, and the move from proof of concept to deployment at scale becomes inevitable. We expect B2B applications to keep growing exponentially and to become the main growth engine for generative AI.
Coding is the leading indicator, and Cursor plus Anthropic is how to watch it
To track the real speed of B2B penetration, we suggest watching the Cursor and Anthropic combination. Revenue at Cursor and Anthropic will be the leading indicator for the whole B2B application market.
Cursor AI is the fastest-growing unicorn by revenue, on a run rate of $100M at the end of 2024, $200M in March 2025 and $500M in June 2025.
Why coding? Because software development is the easiest place to quantify an efficiency gain, and it is the industry most willing to pay for one. Once developers adopt AI-assisted coding at scale, other industries follow.
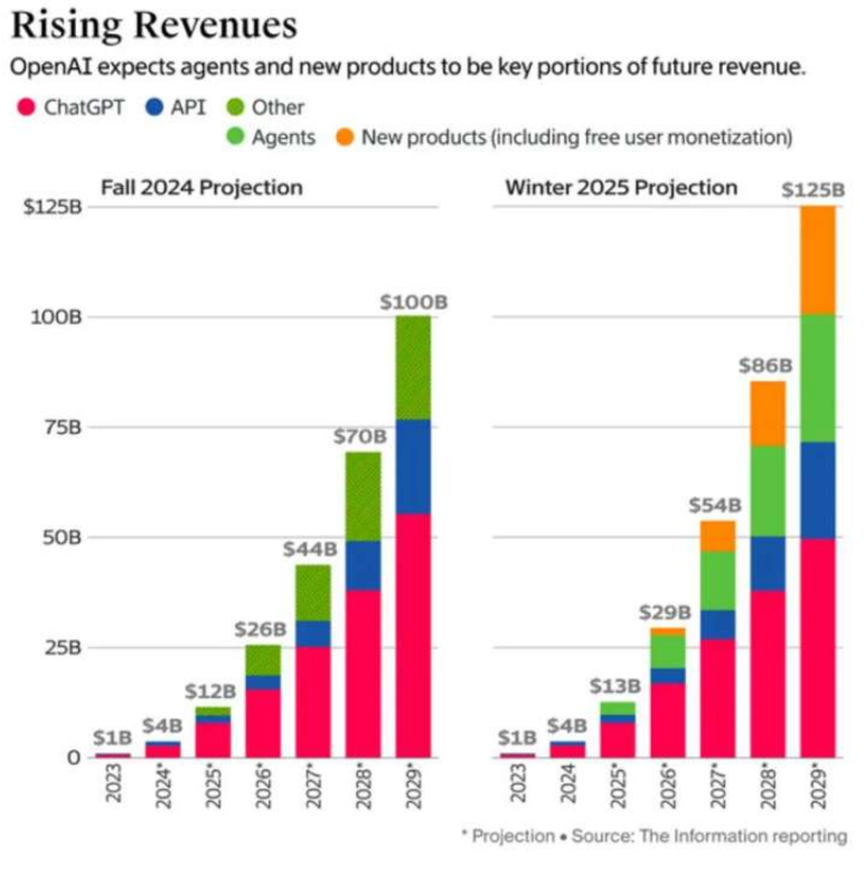
More important, Anthropic is still mostly an API business, roughly 75% of revenue, so any growth in usage feeds revenue directly. For comparison, OpenAI's ChatGPT API revenue for 2025 is estimated at about $2B, while 75% of Anthropic's $4B of ARR is roughly $3B of API run rate, so Anthropic's API business may already be larger.
The industry trend: the API becomes the main growth engine
Agents, whatever form the application takes, run through APIs. So as AI agents spread, the API business should grow far faster than subscriptions.
The reasoning is simple. Subscriptions mostly serve individuals; APIs serve companies and developers, and those customers have far more ability to pay and far more usage. Once AI agents get deployed across enterprise environments at scale, API call volume goes vertical.
Off the back of that industry trend, the two companies have picked opposite paths.
- Anthropic is running an ecosystem strategy: open up quickly to partnerships with every tool vendor, let the specialists in each field do what they do best, pool everyone's knowledge, and concentrate on providing the best API service.
- OpenAI is building it itself: its revenue outlook shows resources going into building its own AI agents, with future revenue mostly subscriptions plus agents, and press reports at the end of June said it is developing office software integrated with ChatGPT, an attempt to build a vertically integrated business model.
We think Anthropic has the better strategy, and we can see it catching OpenAI on revenue within two years, for three reasons.
- Application innovation comes from everywhere. The best use cases for AI agents usually come out of domain expertise in specific verticals rather than what a general platform can imagine, and the network effects of open partnership will show up over time.
- The API grows faster. As B2B applications penetrate exponentially and AI agents spread, the API business should grow explosively and grow much faster than subscriptions.
- It avoids competing with its own customers. If OpenAI builds office software, it is competing head on with Microsoft and other important partners, which is a very high strategic risk.
Strategy still needs the technology behind it. Model quality is what drives adoption, so we continue to think the model companies should put their resources into smarter, more reliable models rather than building applications themselves. Claude performs steadily and reliably in real use, and Anthropic's focus on availability and reliability is exactly what AI agent applications need. (Anthropic works mostly with AWS and Google Cloud on the cloud side.)
The historical comparison for a trend that runs across the cycle: we are at the moment that matters
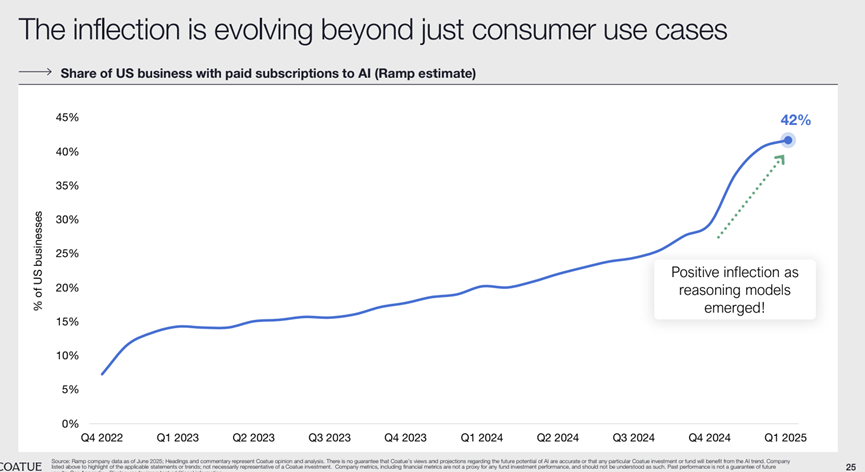
Enterprise adoption of AI has changed in kind, not just in degree. Coatue's June 2025 report shows adoption rising sharply, with a clear upturn after reasoning models were released at the end of 2024.
- Enterprises are adopting paid AI services at scale, and the adoption rate is growing exponentially. The share of US companies paying to subscribe to AI services has jumped from 8% in 2022 to 42% in 2025. A 42% adoption rate means AI is already a mainstream business tool, and it points to a very large market for B2B AI software that raises productivity.
- Reasoning is the key catalyst. Enterprises have started to pay for AI capability that is genuinely worth something, which moves AI from a consumer tool to an enterprise productivity tool.
More important, companies are starting to see the effect in their own numbers.
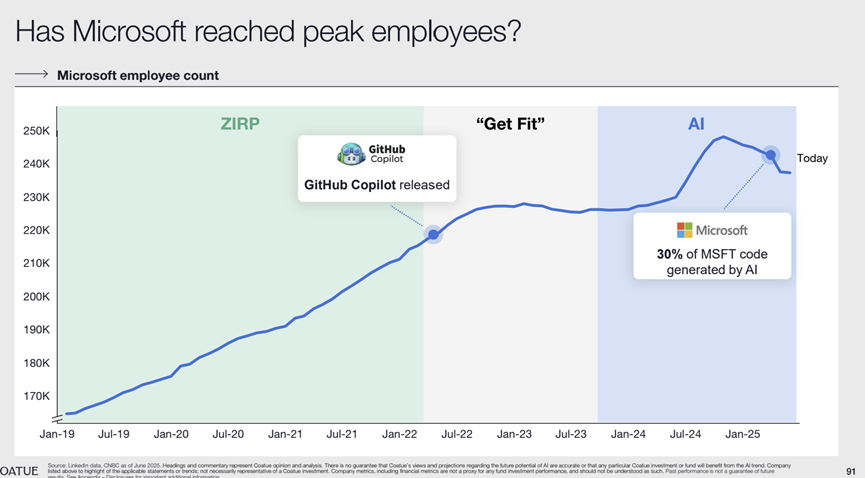
- At Microsoft, 30% of code is written by AI and headcount has started to fall, which in our reading is the efficiency gain showing up directly. When Microsoft announced another 9,000 layoffs in July, 4% of its global workforce, a spokesperson said it would keep making the organizational changes necessary to stay best positioned in a changing market.
- At Amazon, roughly 75% of packages get help from robotic systems somewhere in handling, average headcount per warehouse has fallen to a 16-year low, and the robot count is about to match the number of human employees.
Look back at 1975 to 1980: what the personal computer revolution tells us
While researching the stagflation years we found 1975 to 1980 unusual.
The United States was going through sustained stagflation and the effects of war. From 1969 into the early 1980s the economy alternated between boom and recession (cut rates and you drag on growth, raise them and you fight inflation). Yet 1975 to 1980 produced the longest small-cap rally in history, five years of it. The reason was the arrival of new technology and new industries.
- 1975: IBM launched the IBM 5100, the first machine that resembled a desktop computer.
- 1976: Apple Computer launched the Apple I.
- 1977: three important personal computer models launched, which Byte magazine called the 1977 Trinity.
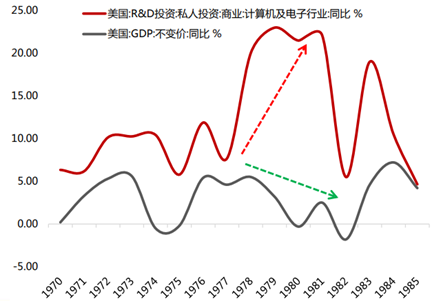
More important, research and development spending on technology kept growing fast even as economic growth kept sliding. From 1973 to 1980, GDP growth went from 5.6% to -0.3%, while growth in research and development spending on computers and electronics went from 10.2% to 21.5%.
Look back at 1995 to 2000: the internet goes commercial
The same thing happened in the internet revolution from 1995 to 2000, and 1995 was the turning point: the US government formally lifted the ban on commercial use of the internet, and with the Mosaic browser having spread from 1993, the network moved from an academic research tool to mass commercial use (the developers behind it went on to release the Netscape browser in December 1994).
That turn produced a cluster of companies. eBay and Amazon were both founded in 1995, portals such as Yahoo! and AOL took off, and e-commerce and online advertising started to scale. The point is that once the technical infrastructure is in place, the application layer grows explosively. That is exactly the pattern we are watching in AI now.
What is different about this AI revolution: the big get bigger
In those earlier disruptions the center of gravity sat with small-cap startups. This time there is an important difference: the cost of entry is extremely high in capital, in technology and in the volume of data required. This is a trend where the big get bigger, so the beneficiaries will be the very large technology companies and the very large unicorns, not the small startups of the 1970s and the 1990s.
The Coatue report shows capital concentrating into a handful of stars. The share of investment going to the top 10 companies has climbed from 8% in 2022 to a projected 52% in 2025. That concentration lines up closely with the AI boom, with the leading AI companies taking most of the money. Investors would rather put large sums into leaders with a proven business model than spread bets across the field.
The combined value of private companies worth more than $50B went from $650B in 2023 to $1.36T today. The very largest private companies, the giant unicorns, are now comparable in size to large public companies.
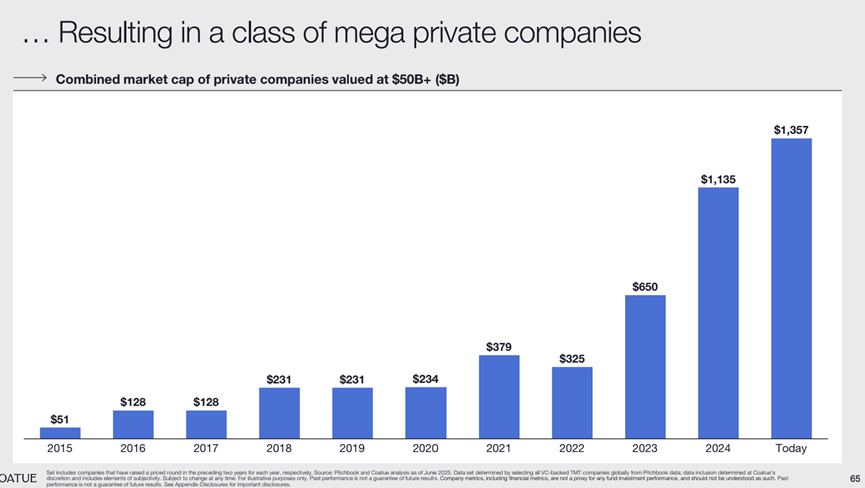
The big getting bigger makes the capital behind the AI revolution more concentrated and more durable. From 1975 to 1980, after the computer was invented, research and development spending kept setting records whatever the macro backdrop. Once a disruptive technology proves its value, capital keeps flowing in until it has completely reshaped the industry.
Bottom line: the data confirms the AI trend is running across the cycle
Six months ago the market was still worried about whether AI investment had gone too far and when applications would land. The data has now given a clear answer.
Vendor revenue, enterprise adoption and headcount have all moved the same way. This is not a bubble, it is the third technology paradigm shift this generation has lived through, after the personal computer in 1975 and the commercialization of the internet in 1995. AI has formally moved from proof of concept to deployment at scale.
As our December 2024 post, The Complete Guide to the Electronics Inventory Cycle, Part 3, put it, a trend runs through the cycle rather than turning with it.
Even with the final sell signal in the electronics inventory cycle already in and geopolitical uncertainty rising, AI applications are still growing faster than expected, and AI investment is holding up as strongly as we judged it would. That is the same picture as computer research and development spending setting records through the stagflation of 1975 to 1980.
History tells us that when a disruptive technology enters its application boom, you get a trend that runs across the cycle. What is different this time is that the beneficiaries are far more concentrated: the top 10 companies' share of investment went from 8% to 52%, and the big getting bigger gives this trend more staying power and sets a higher bar to entry.
From an investment standpoint, with B2B applications starting to penetrate exponentially and the API becoming the main growth engine, we expect 2026 and 2027 to be when AI works its way through existing industries, as people inside the field are forecasting. The names we have tracked throughout stay the core of the book.