
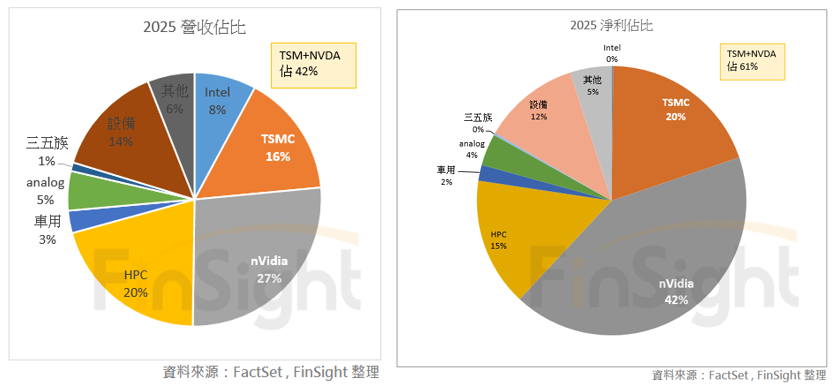
This sell signal hits a changed sector: on 2025 estimates NVIDIA and TSMC are 42% of Philadelphia Semiconductor Index revenue and 61% of its net income.
The bull leg of Taiwan's electronics inventory cycle that began in November 2023 differs from past cycles in one obvious way: this one is pulled by AI demand. In our analysis of last quarter's earnings we already flagged the pattern: big beating small, AI beating non-AI.
Key takeaways
- On 2025 estimates, NVIDIA and TSMC are 42% of Philadelphia Semiconductor Index (SOX) revenue and 61% of its net income, so a non-AI inventory correction does far less damage to the group than it used to.
- Only AI was revised up this quarter. Against estimates from 60 days ago, 2024 operating income for the index was cut 4% and net income 7.3%, with auto and semiconductor equipment taking the deepest cuts to 2025 revenue.
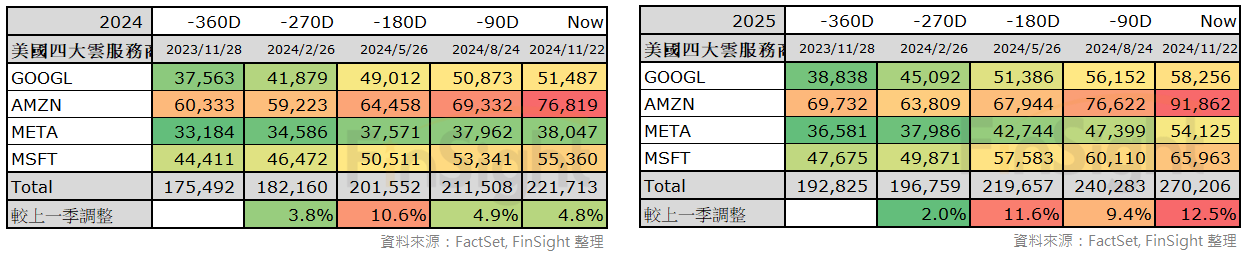
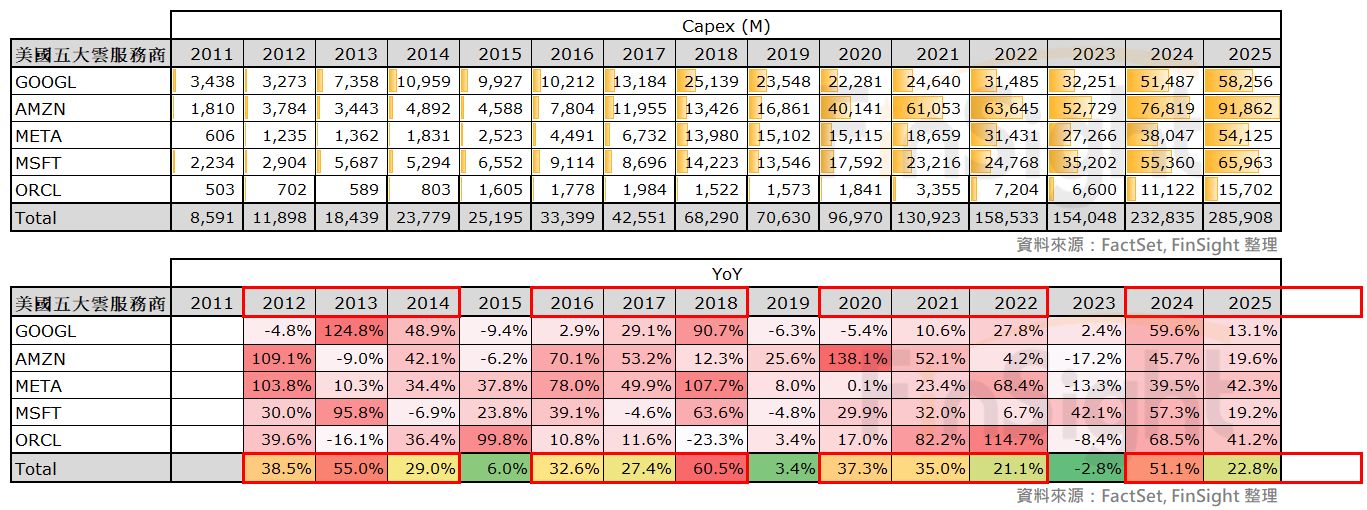
- Capital spending (capex) estimates for 2025 at the hyperscalers, the large cloud providers, have been revised up three quarters running: 11.6%, then 9.4%, then another 12.5%. Past cloud build cycles ran about three years, which points to this one continuing into 2026.
- Split the group into cycle and trend. The risk after this sell signal sits in high-multiple cyclical names: the index traded above 30x forward earnings, past its 2021 peak, while EPS was only back near the prior high.
None of that should be a surprise. In our 2023 series on the AI industrial revolution we argued that the whole AI trend would play out the way NVIDIA CEO Jensen Huang described it back in 2017, as innings of a baseball game: because AI advances on an exponential curve, the leader's advantage keeps widening. As the game moved from stage one (2016 to 2018), the first inning in his framing, to stage two (2019 to 2021) and on to stage three (2022 onward), any company that moved too slowly on deep learning was going to be left behind.
So today we go back over the question: what does the revenue and profit structure of the electronics sector look like now, and how does that change the way we read the inventory sell signal?
Last quarter: only AI was revised up in semis, and non-AI has formally entered a downgrade cycle
In that same series we laid out three stages in the AI trend since it started in 2016.
- Stage one (2016 to 2018), the broad AI boom. Opportunity was open to everyone and companies in every industry had a shot. Firms with data and capital started to build an edge, but the competitive field was still relatively open and no clear split between winners and losers had appeared.
- Stage two (2019 to 2021), the first real divergence. Enterprise demand for cloud services picked up, and business to business (B2B) software as a service (SaaS) companies such as Microsoft and Google, along with the HPC (high performance computing) supply chain of NVIDIA and TSMC, pulled ahead. Consumer SaaS companies without a platform advantage, and legacy chipmakers such as Intel, lost ground.
- Stage three (after ChatGPT in 2022), the strong get stronger. Generative AI sped up the reshuffling of the industry and widened the moats of the companies already ahead. NVIDIA stood alone in compute hardware, and companies like Microsoft that could fold generative AI into services they already sold strengthened their position too. Being ahead does not mean staying ahead forever, but in a data-driven AI era the leaders stack technology, ecosystem, cash flow and data into a much higher barrier to entry. (Note added later: the software side has evolved differently from what we thought at the time. With Anthropic emerging as a strong challenger to OpenAI, the fight among the public cloud giants is far from over.)
On that view, this is a winner-take-all race. AI data volumes keep growing exponentially, stage two took Intel out, and the next stage should widen the leaders' advantage further.
Now look at the latest financial estimates. Against where the analyst consensus we compile stood 60 days ago, revenue estimates for the SOX came out of this earnings season flat to slightly higher, but earnings were cut clearly: 2024 operating income was revised down 4% and net income 7.3%, and the average operating margin across the constituents fell noticeably.
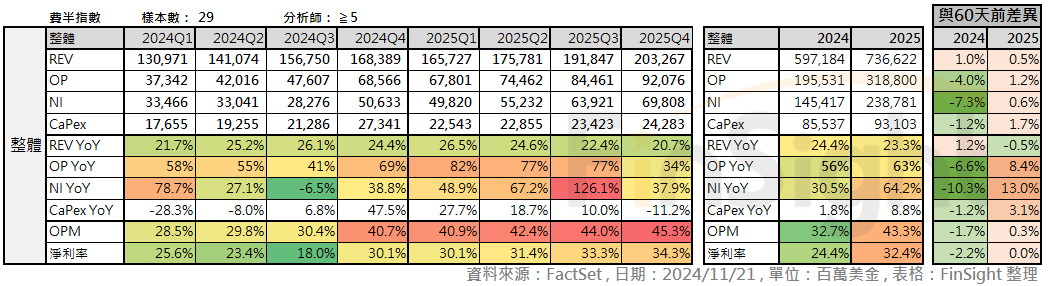
Split the index into sub-industries and the only name with a clear upward revision to revenue is NVIDIA. TSMC was revised up slightly and HPC overall was flat. Everything else, including auto and semiconductor equipment, had its overly optimistic 2025 revenue estimates cut significantly.
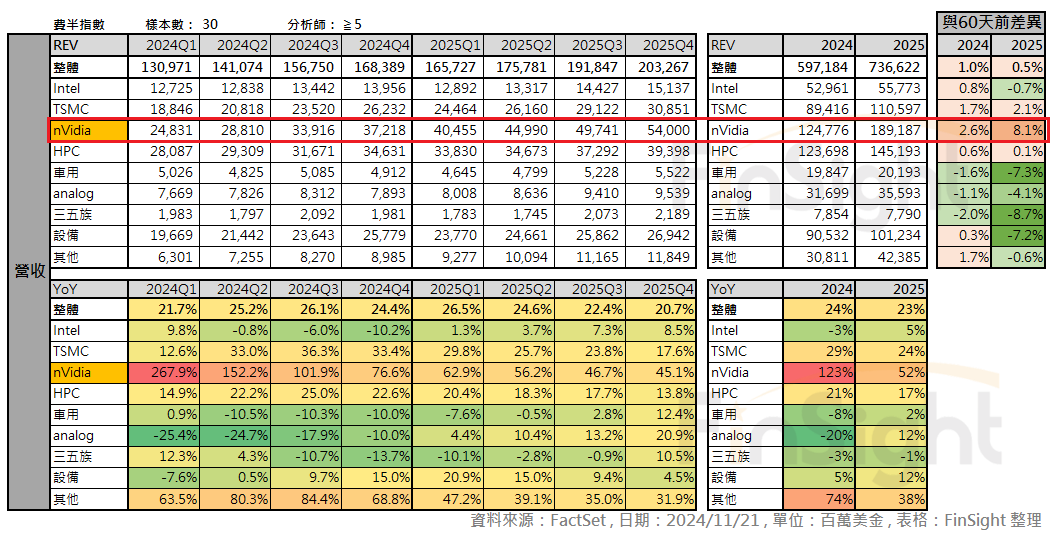
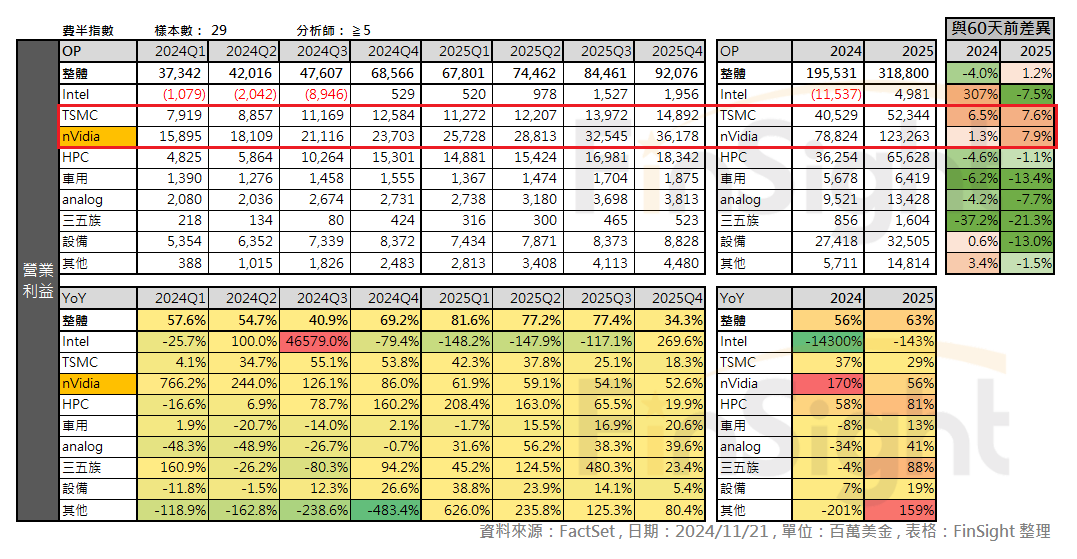
The operating income revisions were sharper still. The only companies revised up meaningfully were TSMC and NVIDIA. Other HPC names were cut against prior estimates, and the cuts elsewhere in semis were larger again. So at the moment the electronics inventory sell signal appears, the non-AI half of the sector is under exactly the pressure the sell signal implies, and analysts have marked down the more optimistic assumptions they carried into this earnings season.
NVIDIA and TSMC now earn more than half of the SOX's profits
In past cycles, once the electronics inventory sell signal appeared, the long-term growth trend stayed intact but a short inventory correction still came through, because a weak overall environment eventually drags on the short-term momentum of even the few secular growth names.
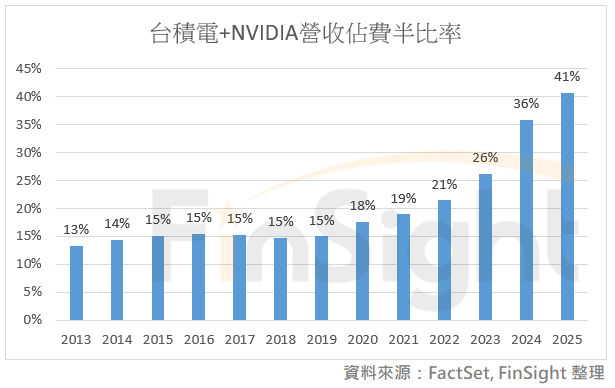
Working through the reported numbers this time, though, the profit structure of the SOX has clearly changed after several years of fast AI growth. NVIDIA and TSMC, whose estimates are still being revised up on the back of the AI build, now contribute more than half the index's profit. On market estimates for 2025, NVIDIA plus TSMC are 42% of SOX revenue and 61% of SOX net income.
Put another way, the non-AI and consumer inventory correction that everyone worries about does much less damage this time than it would have in the past.
Go back through the history of the TSMC and NVIDIA revenue share and the climb gets steeper after 2020, which is exactly when Intel began losing ground under heavy competition and started dropping out of the picture. Generative AI then produced another step up: from 2023 the two companies' share of SOX revenue rose quickly, in line with the three-stage view we set out earlier.
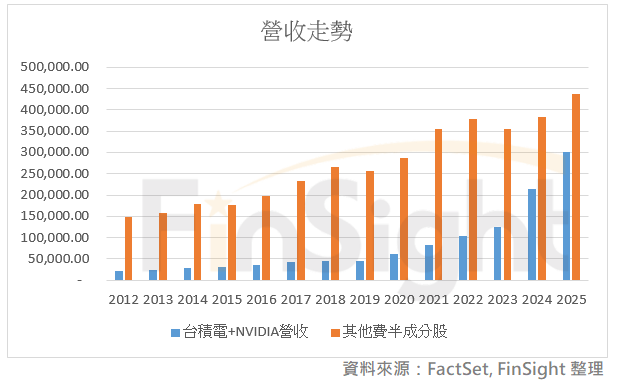
The absolute revenue numbers make it even clearer. Combined revenue for the SOX companies other than TSMC and NVIDIA has been roughly flat from 2021 through this year, with almost no growth. The market still expects a significant recovery in 2025. It expected the same thing before. The market is always optimistic about the future. Whether consumer demand actually recovers is the swing factor. If it does not, the sector could move into the downgrade cycle that normally follows an electronics inventory sell signal.
TSMC and NVIDIA, riding the AI trend, are on a very different revenue path.
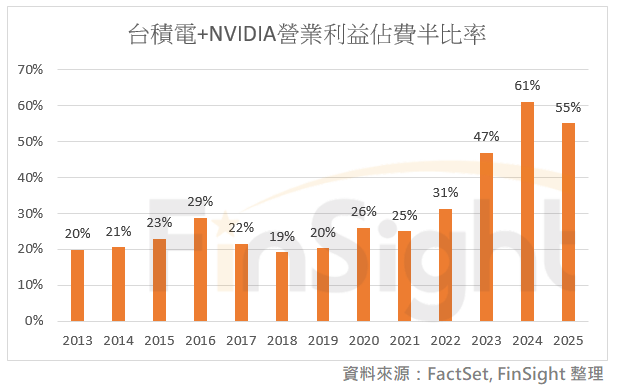
On operating income the gap is far larger.
The market expects the two of them to account for 61% of total SOX operating income this year, up sharply from 47% last year. That says they are not just taking most of the market's growth; they are concentrating the profit too. The operating income gap got more pronounced this quarter as everyone else was revised down.
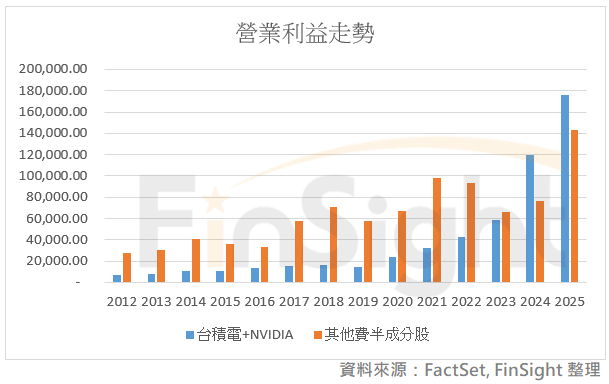
In absolute terms, combined operating income for the SOX companies other than TSMC and NVIDIA peaked in 2021, fell in 2022 and fell hard in 2023. The 2024 estimate is a recovery, but still below the 2022 level. The market is nonetheless very optimistic that 2025 delivers strong growth to a new high. If non-AI demand comes in below expectations, watch for further downward revisions.
Against that, TSMC and NVIDIA's combined operating income in 2024 is already larger than what the rest of the SOX earned in 2021.
The same thing is happening outside the United States. TSMC's share of the operating income of the whole Taiwan electronics sector has climbed to roughly half.
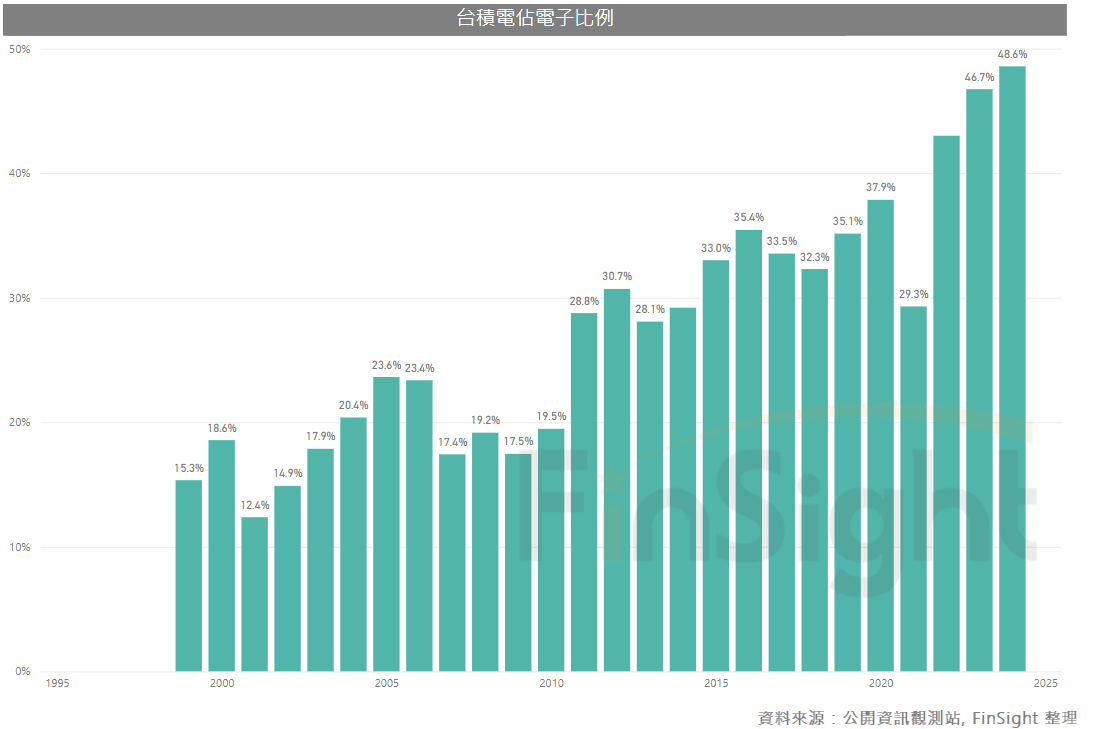
This bull cycle is AI-driven, so the list of winners was always going to get shorter
- NVIDIA's argument is that exponential AI growth keeps widening the leader's advantage. The reported financials back that up: the group of companies that actually benefit from the trend keeps getting more concentrated.
- Through this bull cycle, though, the market has been setting expectations off the shape of past cycles, so it has kept looking for the other industries to recover. That shows up in the optimistic 2025 estimates. If non-AI demand recovers more slowly than expected, further downward revisions are possible.
- For AI momentum to hold, it comes down to the financial condition of the people writing the checks at the end of the chain. Our earlier note on the hyperscalers' AI strategy, written after the third quarter 2024 results, found capex still being revised up and likely to run into 2026, with no sign yet of AI investment slowing. That still has to be checked against the pace of frontier model releases, software revenue at the application layer, public cloud growth and hyperscaler financials.
- Carried by the AI story, the SOX at one point traded above 30x forward earnings, past its 2021 peak, while EPS was only back near the prior high. The two biggest AI beneficiaries, TSMC and NVIDIA, have not taken their own valuations past 2021 levels. So the names to avoid after this inventory sell signal are the ones carrying a high multiple and a growth number that may still have to come down.
Looking at TSMC's main customers, the overall estimate changes are small, but net income was trimmed slightly, which is worth watching.
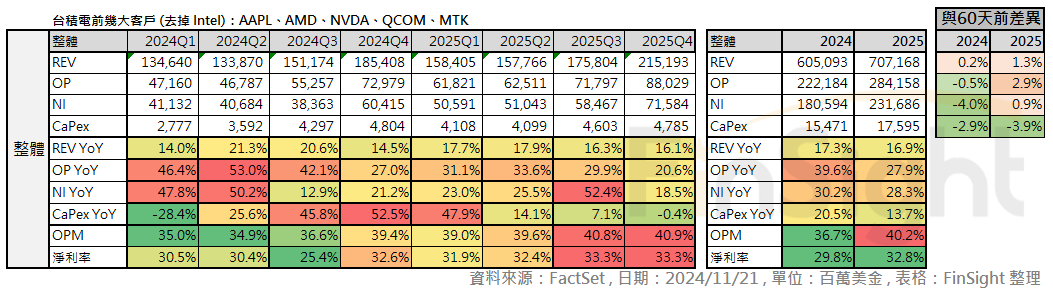
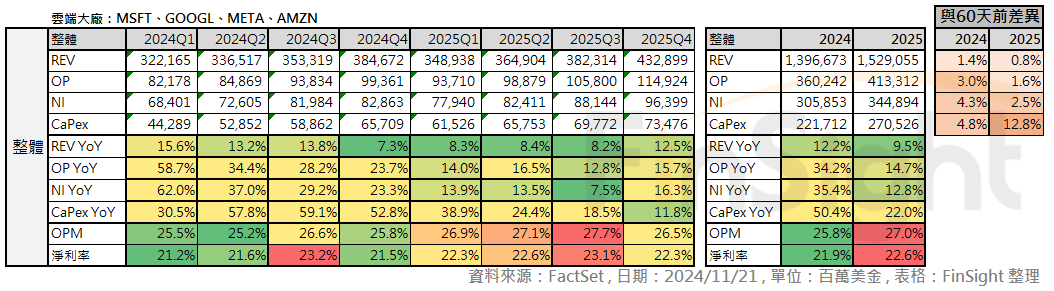
NVIDIA's main customers are still seeing revenue and profit revised up after this earnings season, so they keep raising capex sharply. Public cloud growth still looks healthy, and for now there is no major risk on the demand side.
Our own view: if you accept the forecasts we compiled in our July 2024 post on what GenAI insiders expect, then even if these companies' profits come under pressure it will be very hard for them to stop spending, because whoever ships the next smart model first may take the whole market. That race could put real applications in the market as early as 2026. One checkpoint will be the first quarter of 2025, the quarter where several hyperscalers said they expect a real contribution from AI: Microsoft's capacity constraint is due to ease, so Azure growth should improve.
Look at how analysts have moved their hyperscaler capex estimates over this stretch. Not only is 2024 investment being revised up step by step, the 2025 capex estimate has now been revised up sharply three quarters running: 11.6% in the second quarter, 9.4% last quarter and another 12.5% this quarter.
History says that once a capex up-cycle starts it runs at least three years. In every previous wave of enterprise migration to the cloud, capex grew for about three years, then paused for a year as industry demand weakened, with no growth in that pause year. The cyclicality is clear, and each leg had a concrete demand reason behind it.
So with this capex expansion starting in 2024, history points to it running into 2026.
Bottom line: this sell signal calls for separating the cycle from the trend
Compared with past cycles, the AI beneficiaries now account for more than half of total profit. The structure of the whole electronics group has changed fundamentally, so the way we read the signal has to change with it.
- Look back at when the electronics inventory buy signal appeared. The market was excited about the AI build and expected consumer products to catch up, so it started revising up its expectations for the other sub-industries. When Apple launched Apple Intelligence, those expectations were maxed out.
- Now the preliminary electronics inventory sell signal is here. Consumer demand is not as strong as people thought, autos, which had been driving electronics growth, are still in an inventory correction, and AI demand is the only thing running hot. On top of that, non-AI names started getting revised down this quarter. From here, watch the pressure on cyclical names that carry a high multiple and may still be cut.
So from where we stand now, we split individual names into cycle and trend.
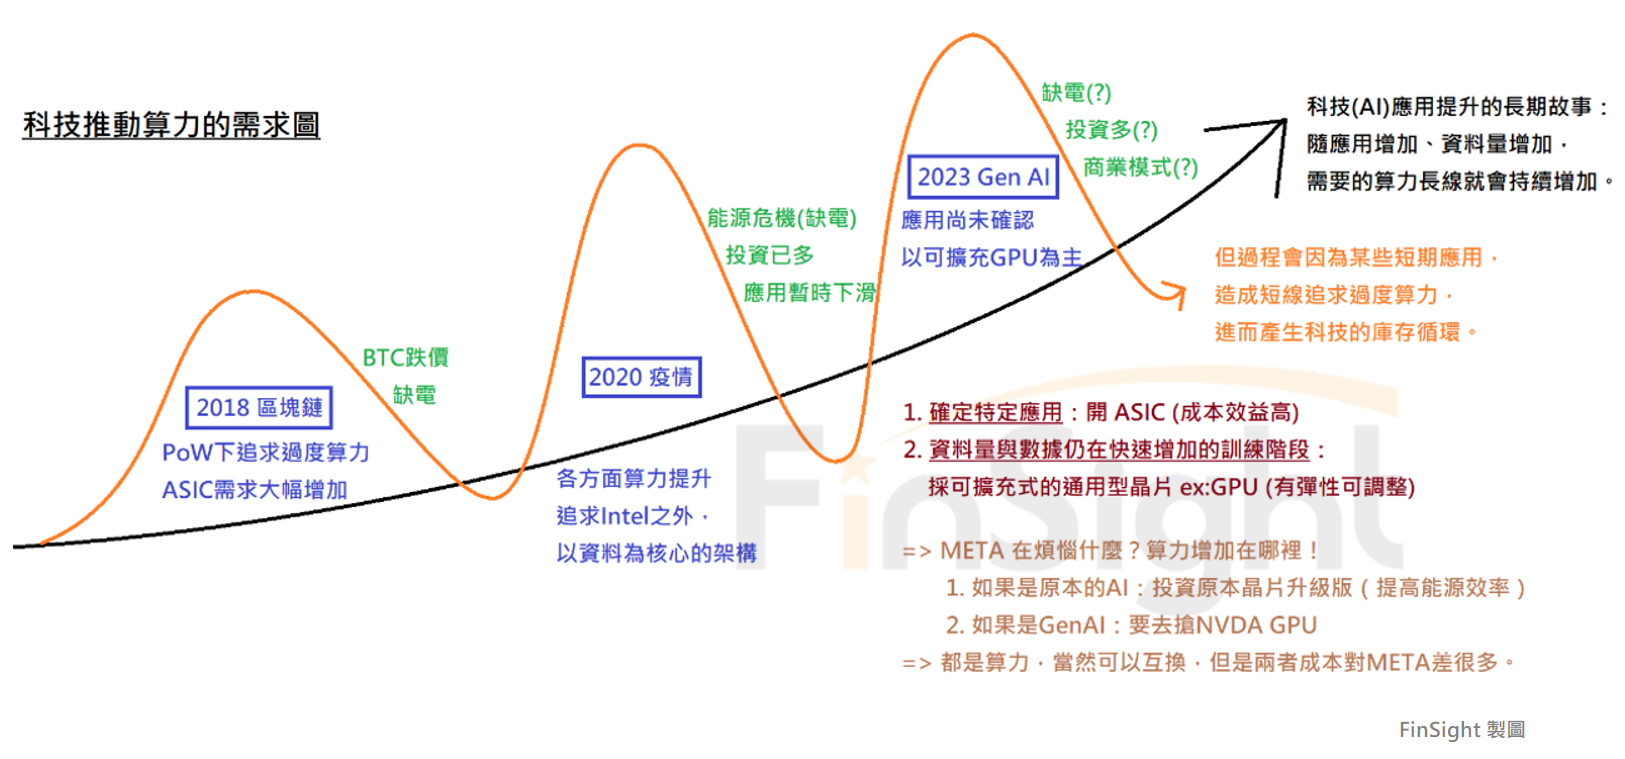
The electronics inventory cycle describes a short-term phenomenon: a pause after too much compute gets built or too much consumer spending gets pulled forward. But compute demand keeps compounding through the pause, which is why spending on more efficient compute never stops.
The AI trend still looks healthy and the spending could run all the way to 2026. We will update that view as new information comes in, against the four checks listed above. On the other side, we are worried that if consumer demand disappoints, the market's optimistic expectations for the cyclical names have to be cut, and where those names carry a high multiple, the downside pressure is heavier.
How will this electronics inventory sell signal actually affect the trend? We do not know. In the last post of this series we will go through the different ways to look at that, and how we adjust positions when the two main lines of our research point in opposite directions.