
Ten years of TSMC inventory signals: every time the rule sold, it had to buy back higher. The 2024 signal splits the sector, non-AI 2025 estimates cut 6.4%.
This is the last post in our three-part guide to the Taiwan electronics inventory cycle. Part 1 walked back through the buy and sell signals and showed that after a preliminary sell signal, the TWSE electronics sector index (the electronics index), which makes up the bulk of Taiwan's market cap, has historically fallen about 20% over the following six months. Part 2 covered what AI changed in this up-cycle: the companies that benefit from AI now account for more than half of sector profit, which may mean the buy and sell signals read differently than they used to. This last post steps back to the relationship between trend and cycle, and to how different kinds of investors should treat this sell signal. Research is only worth something once it is matched to how you actually trade. Your style decides which information matters to you.
Key takeaways
- Across four cycles since 2013, every TSMC buy-back price came in above the previous sell price: bought at NT$104 and sold at NT$144, bought back at NT$179 and sold at NT$244, bought back at NT$248 and sold at NT$572, bought back at NT$581 and sold at NT$977.
- Add the dividends, roughly NT$10 to NT$12 a share in cash in recent years, and simply holding TSMC beat trading the inventory signals over the past decade, which is why we now use the signals to size the cyclical names rather than to trade the trend names.
- The October 2024 sell signal has split the sector: 2025 earnings estimates for Taiwan electronics excluding TSMC were cut 6.4% over the past 60 days, which still leaves consensus at 23% growth, while TSMC's net income estimate was revised up 13%, to 29% growth.
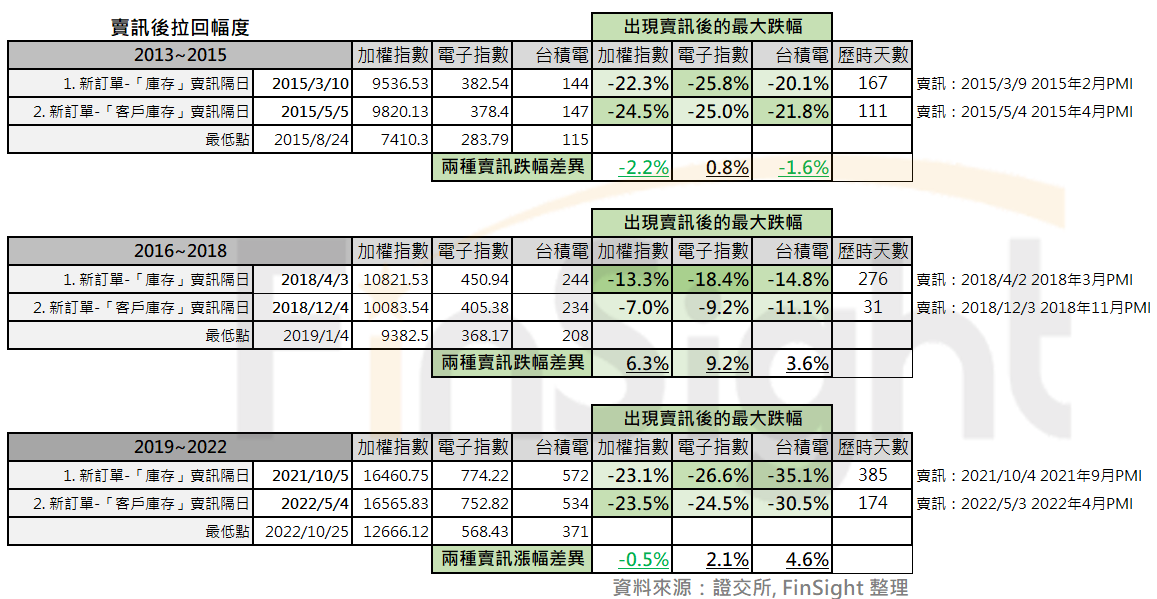
- We still respect the cycle. If the final sell signal appears, meaning new orders minus customers' inventories on Taiwan's purchasing managers index (PMI) turns negative, history points to a drawdown of about 20% over the next six months. So we hold the AI chain through it and trade the traditional electronics names around it.
Ten years of inventory signals, scored against buy and hold
Take TSMC, one of the biggest beneficiaries of this AI trend, and score the last decade of inventory buy and sell signals. Prices are in New Taiwan dollars, roughly 30 to 32 per US dollar across this period.
- 2013 to 2015 cycle: buy signal on November 15, 2013 at NT$104. Preliminary sell signal on March 10, 2015 at NT$144; final sell signal on May 5, 2015 at NT$147.
- 2016 to 2018 cycle: buy signal on August 15, 2016 at NT$179. Preliminary sell signal on April 3, 2018 at NT$244; final sell signal on December 4, 2018 at NT$234.
- 2019 to 2022 cycle: buy signal on August 15, 2019 at NT$248. Preliminary sell signal on October 5, 2021 at NT$572; final sell signal on November 15, 2023 at NT$534.
- 2023 to 2024 cycle: buy signal on November 15, 2023 at NT$581. Preliminary sell signal on October 4, 2024 at NT$977; the final sell signal has not appeared yet.
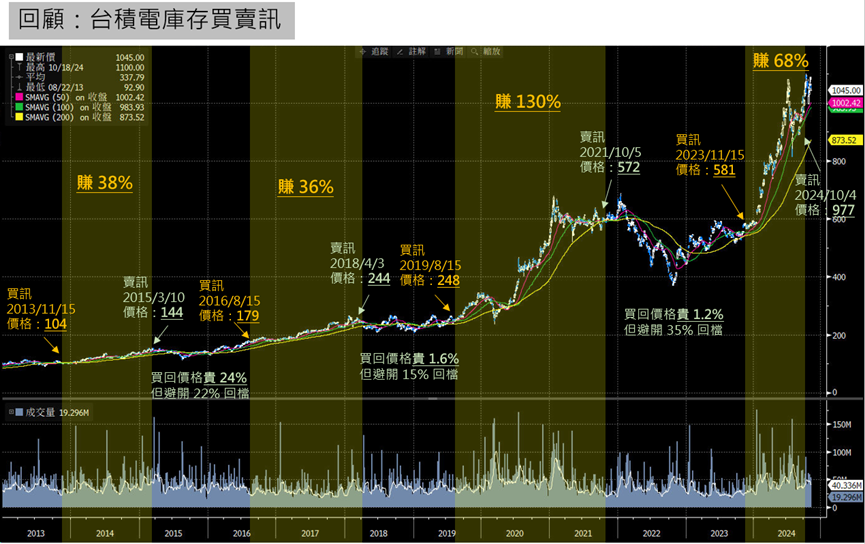
One thing jumps out. If you followed the rule strictly, selling on every sell signal and buying back on every buy signal, the buy-back price was higher than the sell price every single time. Add the dividend income over the period, roughly NT$10 to NT$12 a share in cash in recent years, and buy and hold looks clearly better.
That says something important about technology. Under a strong technology trend, a short inventory correction is usually just a wobble inside a long uptrend. The long-run value created by technical progress is the real driver.
As we said in our July and September 2023 posts on the AI industrial revolution, when the volume of data being computed grows exponentially, the industry's push for better energy efficiency in compute never stops.
Pick a strategy that fits you
Which brings up the core question: what kind of investor are you?
In our December 2022 post on the three trading styles and the research each one needs, we made the point that once you understand how a piece of research is meant to be used, you still have to run it through your own trading logic.
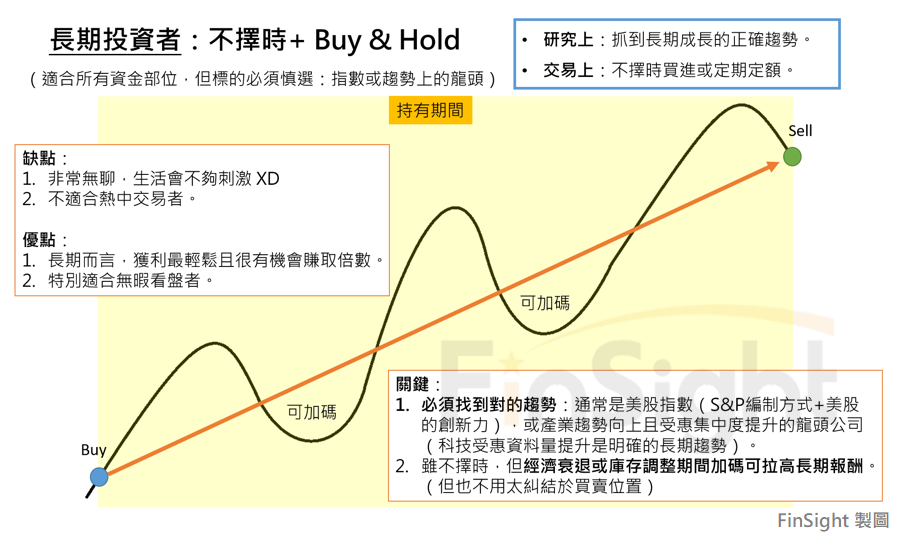
Long-term trend investors concentrate on the long-run value that technology innovation creates: the AI revolution, better compute performance. For them the inventory buy and sell signals do not mean much, and buy and hold is the better fit.
- Focus: the long-run value created by technology innovation.
- Strategy: buy and hold the core positions, and add or dollar-cost average through recessions and inventory corrections.
- Edge: lower transaction costs, less emotional strain.
- Challenge: the position has to sit through bigger swings.
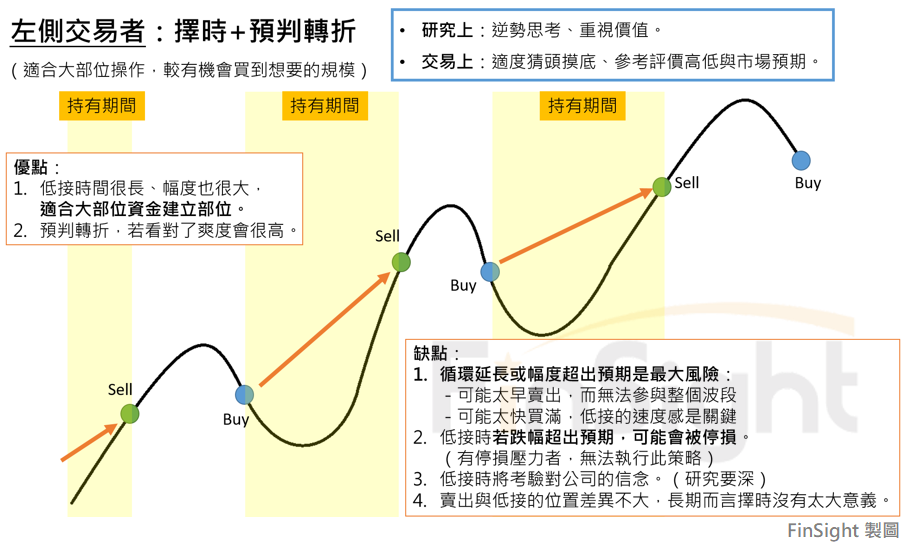
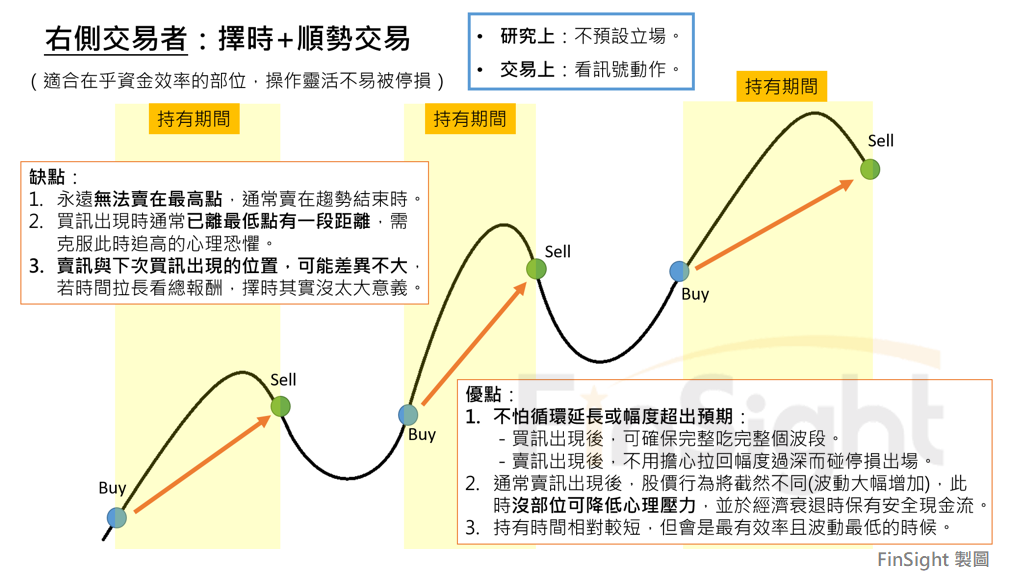
Tactical investors watch the three to five year mid-cycle and use the inventory signals to adjust position size, picking up extra return on the swings. The catch is that this takes a lot more time and attention to track. A left-side trader acts before the turn is confirmed and scales in or out gradually; a right-side trader waits for the turn to be confirmed and then trades with it.
- Focus: the three to five year mid-cycle, meaning the inventory signals, shifts in industry supply and demand, and where valuation sits.
- Strategy: use the cycle to adjust position size, or to rotate across assets at different points in it.
- Edge: potentially smaller drawdowns, plus extra return on the swings.
- Challenge: more time and effort, and a higher bar for managing your own emotions.
Our own approach today: hold the core positions through the long technology trend, and treat the inventory cycle as a reference point for sizing. On that model, the window between a sell signal and the next buy signal is a good chance to put cash to work on pullbacks. It takes the best of both: you do not miss the long trend, and you still use the cycle to size positions. For now it is probably the best fit for us.
This sell signal: the non-AI down-cycle has already started
We said in the previous post that the structure of the sector has changed a lot. Even so, after the preliminary electronics inventory sell signal fired in October 2024, we are still seeing clear cuts to corporate earnings. What is different is the composition.
- Consumer electronics is being cut hard. Over the past 60 days, 2025 earnings estimates for the Taiwan electronics group excluding TSMC were cut 6.4%, which still leaves consensus at 23% growth.
- TSMC keeps getting revised higher. Its net income estimate went up 13%, to 29% growth, which says AI demand is still strong.
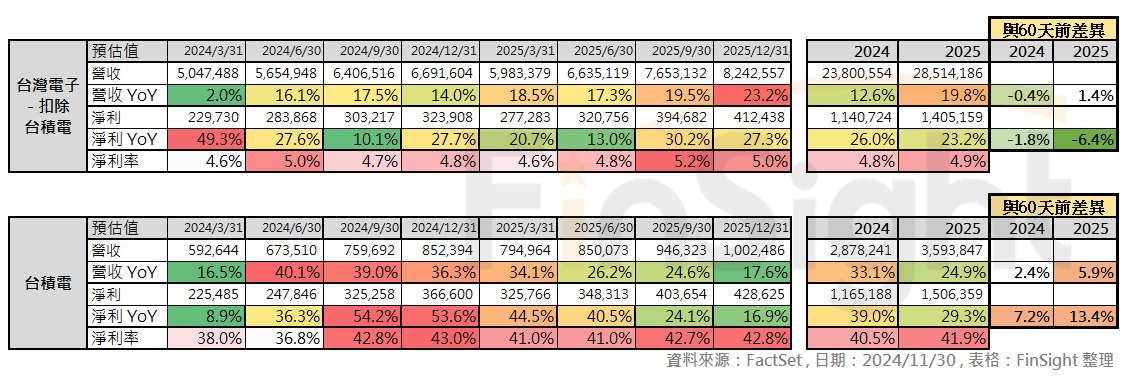
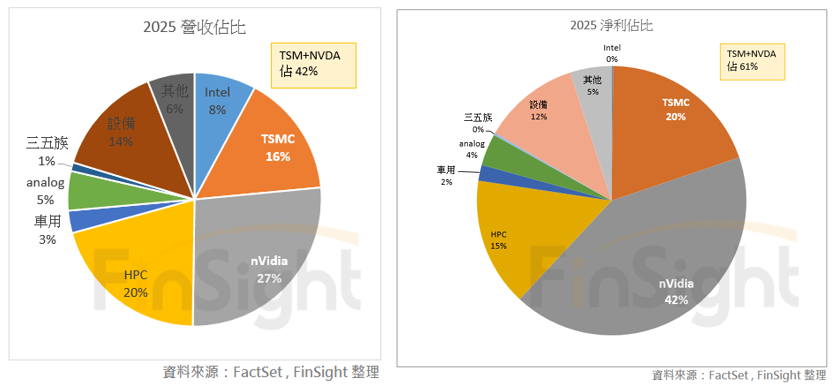
The divergence mostly comes back to the structural change we laid out in the previous post.
- The profit pool has been rebuilt. NVIDIA and TSMC together contribute more than 60% of the profit in the Philadelphia Semiconductor Index (SOX), the moats around the AI names keep getting deeper, and the winner-take-all effect is more visible. Each hyperscaler, meaning each of the large cloud providers, designing its own application specific integrated circuit (ASIC) only helps TSMC further.
- AI end applications are landing faster and demand is opening up. Frontier model capability keeps improving, enterprise deployments are starting to scale, software revenue at the application layer is showing up, and CIO surveys point to optimism about cloud migration spending next year. On the demand side we see no problem so far.
- The investment cycle is getting longer. The path from frontier models to public cloud to agents is clearer, 2026 to 2027 could bring an application boom, and for strategic reasons the major players will find it hard to cut spending.
Our own view is that the inventory cycle is still there, so we stay wary of the index drawdown that has followed past sell signals. The final sell signal is the PMI spread we defined in Part 1 (new orders minus customers' inventories). On the historical pattern, once the final sell signal appears, the following six months have brought a drawdown of around 20%.
The cycle is still there, but its impact has split.
- The AI chain has a long-run trend underneath it, so the inventory cycle hits it less. If application-layer software does get hit, a more obvious inventory correction becomes possible, as happened in both 2018 and 2022. But in our December 2024 post on the 2024 generative AI market, the current readings still looked healthy.
- Traditional consumer electronics could face sharper pressure to correct, which is showing up in what several companies have said recently, including Micron, which reported this week.
So here is how we would position from here.
- AI chain: the long-run trend gives it more resistance to the cycle, so we hold the core names on a trend basis.
- Traditional electronics: the cyclical swings could get wider, so we use the inventory signals to adjust position size.
- Keep tracking the progress from frontier models to public cloud to agents, and stay flexible about it. On our current read, prepare for the application boom that could arrive in 2026 to 2027. But if the indicators we watch break down and demand slows, go back and check whether the original assumptions need to change.
- Key indicators to watch: the pace of frontier model releases and capability gains, revenue growth at application-layer software, the financial condition of the public cloud providers, and any change to capex plans.
Bottom line: against a technology revolution, compounding is the strongest force
Looking back at this sell signal from the end of 2024, the most useful lesson may be that in this AI-driven phase, the investment logic for electronics has to move with the times. The inventory cycle is still there, but its impact has split because the industry structure has been rebuilt, and that will widen the gaps between industries.
The power of compounding over time is startling. The record shows that with technology innovation pushing underneath, long-term investors have collected most of it. Inventory cycles come and go, but the industry revolution that technology innovation drives is the real engine of long-run growth, and holding through the cycle compounded faster here than trading it. Every investing style has its place, and what matters is finding the road that fits you.
Against that background, finding an investment rhythm that fits you probably matters more than nailing every cycle. For the core technology trend names, we would hold for the long run and treat the inventory cycle as a reference for sizing or adding. For the traditional electronics names, you can be more aggressive about using the cycle indicators to allocate.
A postscript: thanks for reading all three parts. This is the work we most enjoy doing, and we hope it was worth your time.