
Big Tech's $2.3T of off-balance-sheet commitments are in plain sight. We map who carries the risk if AI disappoints and what signals a capex pause.
Part 1 of this series, published September 21, 2026 ("AI Debt, Part 1: Big Tech Can Fund Its 2027 Capex. Can AI Earn the Money Back?"), asked whether the five hyperscalers (Microsoft, Google, Amazon, Meta and Oracle) have enough money for next year's capital spending (capex). If 2027 capex is $1.2T, they need to borrow less than they did this year. If it is $1.4T, they need to borrow 1.4 times this year's amount. The market can still lend that much. It will just charge more.
Key takeaways
- The "hidden" debt is in plain sight. The five hyperscalers have more than $2.3T of future payments that are not on their balance sheets, and all of it is disclosed in the notes to their financial statements. Once the $1.12T of signed leases have all started, the rent comes to roughly $60B a year, about 6% of next year's operating cash flow.
- In circular financing, where suppliers invest in and guarantee their own customers, everyone shares the loss when it fails, but not equally. The big four have their own cash flow to fall back on. The landlords feel it first, Oracle most of all, with about half its orders from OpenAI. At the end of the chain is OpenAI, whose own plan has it burning $278B of cash over five years.
- As a group the five hyperscalers can take the hit, though Oracle is already over our line. If cash flow falls 20% and they cut capex 10%, the size of Meta's 2023 cut, combined debt is 1.20 times a year of EBITDA (earnings before interest, taxes, depreciation and amortization; roughly, cash earnings). That is well inside 1.5 times, our own line for where ratings would come under pressure, not a rating agency threshold. Among the big four, only Meta would need a somewhat deeper cut. Shareholders and suppliers take the pain: a 25% cut would mean the five hyperscalers combined spend about $300B less.
- For stocks, a pause matters more than a cut, and it comes first. We expect the signals in this order: prices at the landlords, then a capex pause at the big four, then the first real guidance cut. Our three warning lights today: landlord rents green, the bond market yellow, the big four's guidance and supply chain orders green. We still see the virtuous cycle as more likely.
Money is not the problem, so the thing to watch is whether AI earns the money back. This post takes the next question: what happens if it earns less than expected?
We pick up from the chart at the end of Part 1. The same borrowing structure can go two ways. If AI really earns the money back, it follows the virtuous cycle on the left. If it earns less than expected, it follows the vicious cycle on the right. Real customers stop paying, signed contracts don't turn into revenue, and the shortfall has to be borrowed, in larger amounts and at higher rates. The landlords buckle first. By landlords we mean the neoclouds (newer cloud companies that rent out AI chips) and data center operators that borrow to build capacity for others, such as CoreWeave and Oracle in this piece. The four largest hyperscalers (Microsoft, Google, Amazon and Meta, the big four) may pause capex, or go further and cut it. And every dollar they don't spend is a dollar of revenue the supply chain loses.
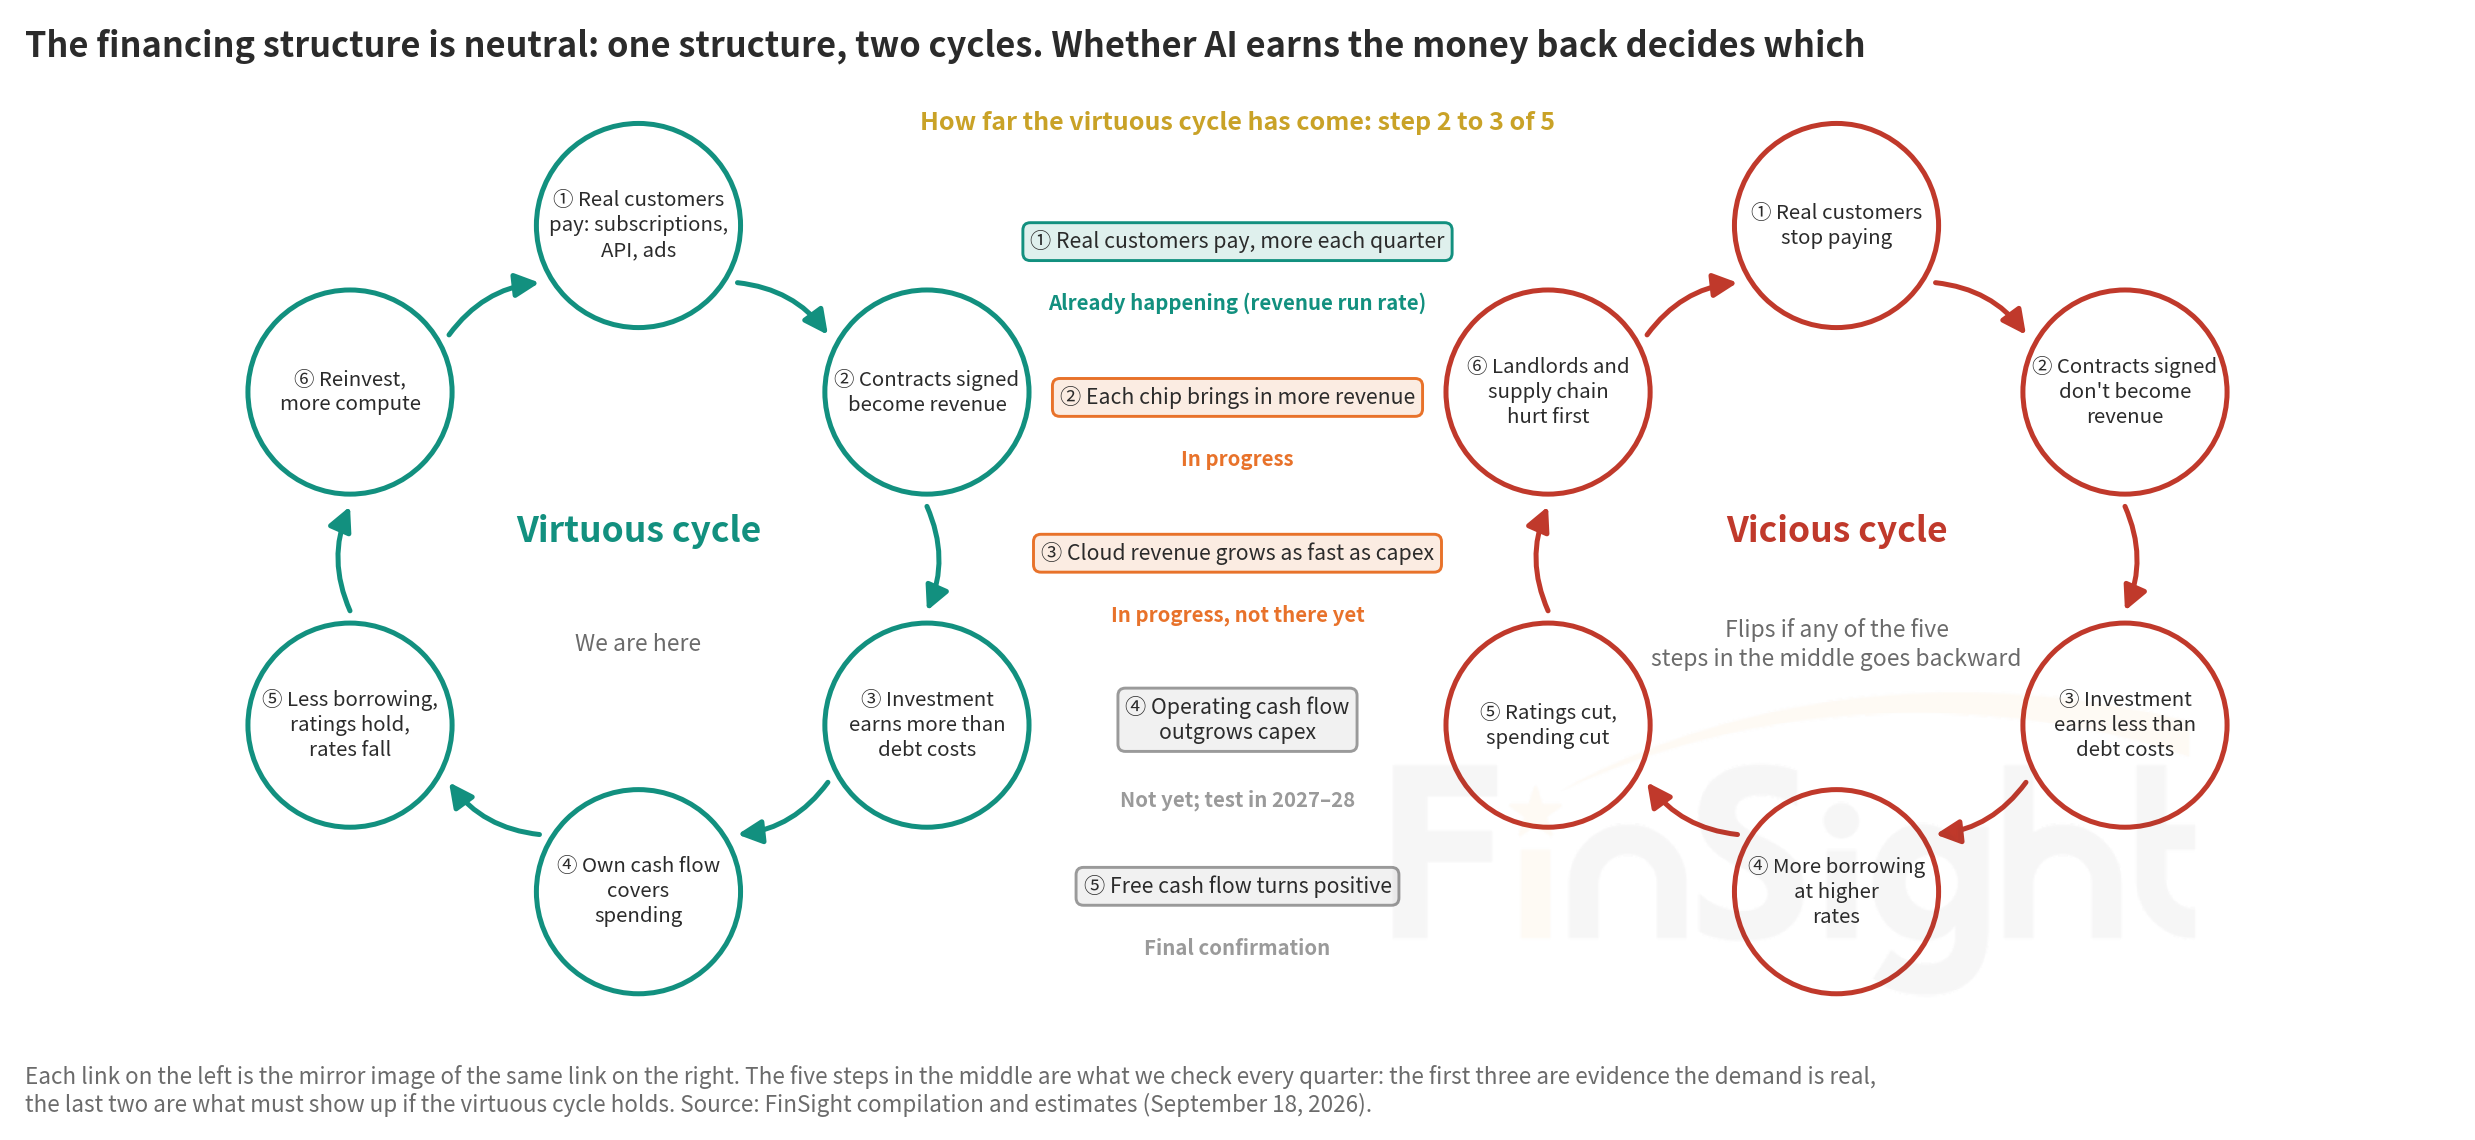
To restate our view: we have no doubt about AI as a long-term technology trend, and of the five steps we use to track whether AI is paying off (Part 1 laid them out; they are listed again below), step one is confirmed and steps two and three are moving the right way. What we care about are the mini-cycles inside the trend. Every round of tech investment has a stretch where companies overbuild and then pull back to work off inventory. The price of overbuilding is a drop in stock prices, and stocks often move ahead of the fundamentals. They don't wait for the earnings reports.
So this post has two halves. The first half takes a hard look at the risks in the vicious cycle: where the market's "trillions of dollars of debt hidden off the balance sheet" actually sits and what it looks like, and who carries the loss if the circular financing among a few companies breaks down. The second half returns to the question the stock market really cares about: what would make the companies pause capex, and which numbers we watch.
What does the "trillions in hidden debt" look like? It is all disclosed, and most of it is contracts signed years ahead
The five hyperscalers have more than $2.3T of payments they are committed to making that are not on their balance sheets. About $1.12T is leases signed but not yet commenced: the lease is signed, but the data center isn't ready and the rent hasn't started. The rest is purchase commitments for things like chips and power. The big four disclose about $1.2T of those combined, including $707B at Google alone and $349B at Meta.
All of it is in the financial reports, just not all of it on the balance sheet. It sits in one of three places: (1) on the balance sheet under a different name, (2) on the balance sheet but only a small part, and (3) off the balance sheet, in the notes only; Table 1 calls these Buckets 1, 2 and 3. The largest piece is in the notes. Each of the five does it differently:
| Company | Main method | Size (latest disclosure) | Where it shows up in the financials |
|---|---|---|---|
| Meta | Borrows off balance sheet through a separate entity, then adds a residual value guarantee | Hyperion data center vehicle $27.3B (6.581% interest rate) + El Paso vehicle $12.6B (7.534%) | Bucket 3: notes only (part moves to Bucket 2 once the leases commence) |
| Microsoft | Finance leases (leases recorded like a loan) tucked into "other liabilities" | Finance lease liabilities of $66.6B (2.45 times the level two years ago); another $329.1B of leases signed but not yet commenced | Bucket 1 + Bucket 3 |
| Provides payment guarantees on third-party data center leases (booked as credit derivatives) | Guarantees up to $43.8B, of which under $1B is booked on the balance sheet | Bucket 2: on the balance sheet, but only a small piece | |
| Amazon | Borrows openly in the public bond market, plus a large volume of leases signed but not yet commenced | Three bond deals this year: more than $50B in March, another in July, and its first in British pounds in September; $137.2B of leases signed but not yet commenced | On the balance sheet + Bucket 3 |
| Oracle | Relies on long leases that commence in stages | $288B of leases signed but not yet commenced (end of August) | Bucket 3: notes only |
Bucket 1 = on the balance sheet, just not called debt. Bucket 2 = on the balance sheet, but only a small piece is recorded. Bucket 3 = off the balance sheet, disclosed only in the notes. Residual value guarantee = if the asset is worth less than expected at the end, the guarantor pays the difference.
Source: Company 10-Q and 10-K lease and commitment notes (June quarter for the four, August quarter for Oracle), bond offering documents and rating agency announcements; FinSight compilation
Here are the two biggest pieces side by side, and how they grew. On the left are leases signed but not yet commenced. On the right is what the companies have agreed to buy:
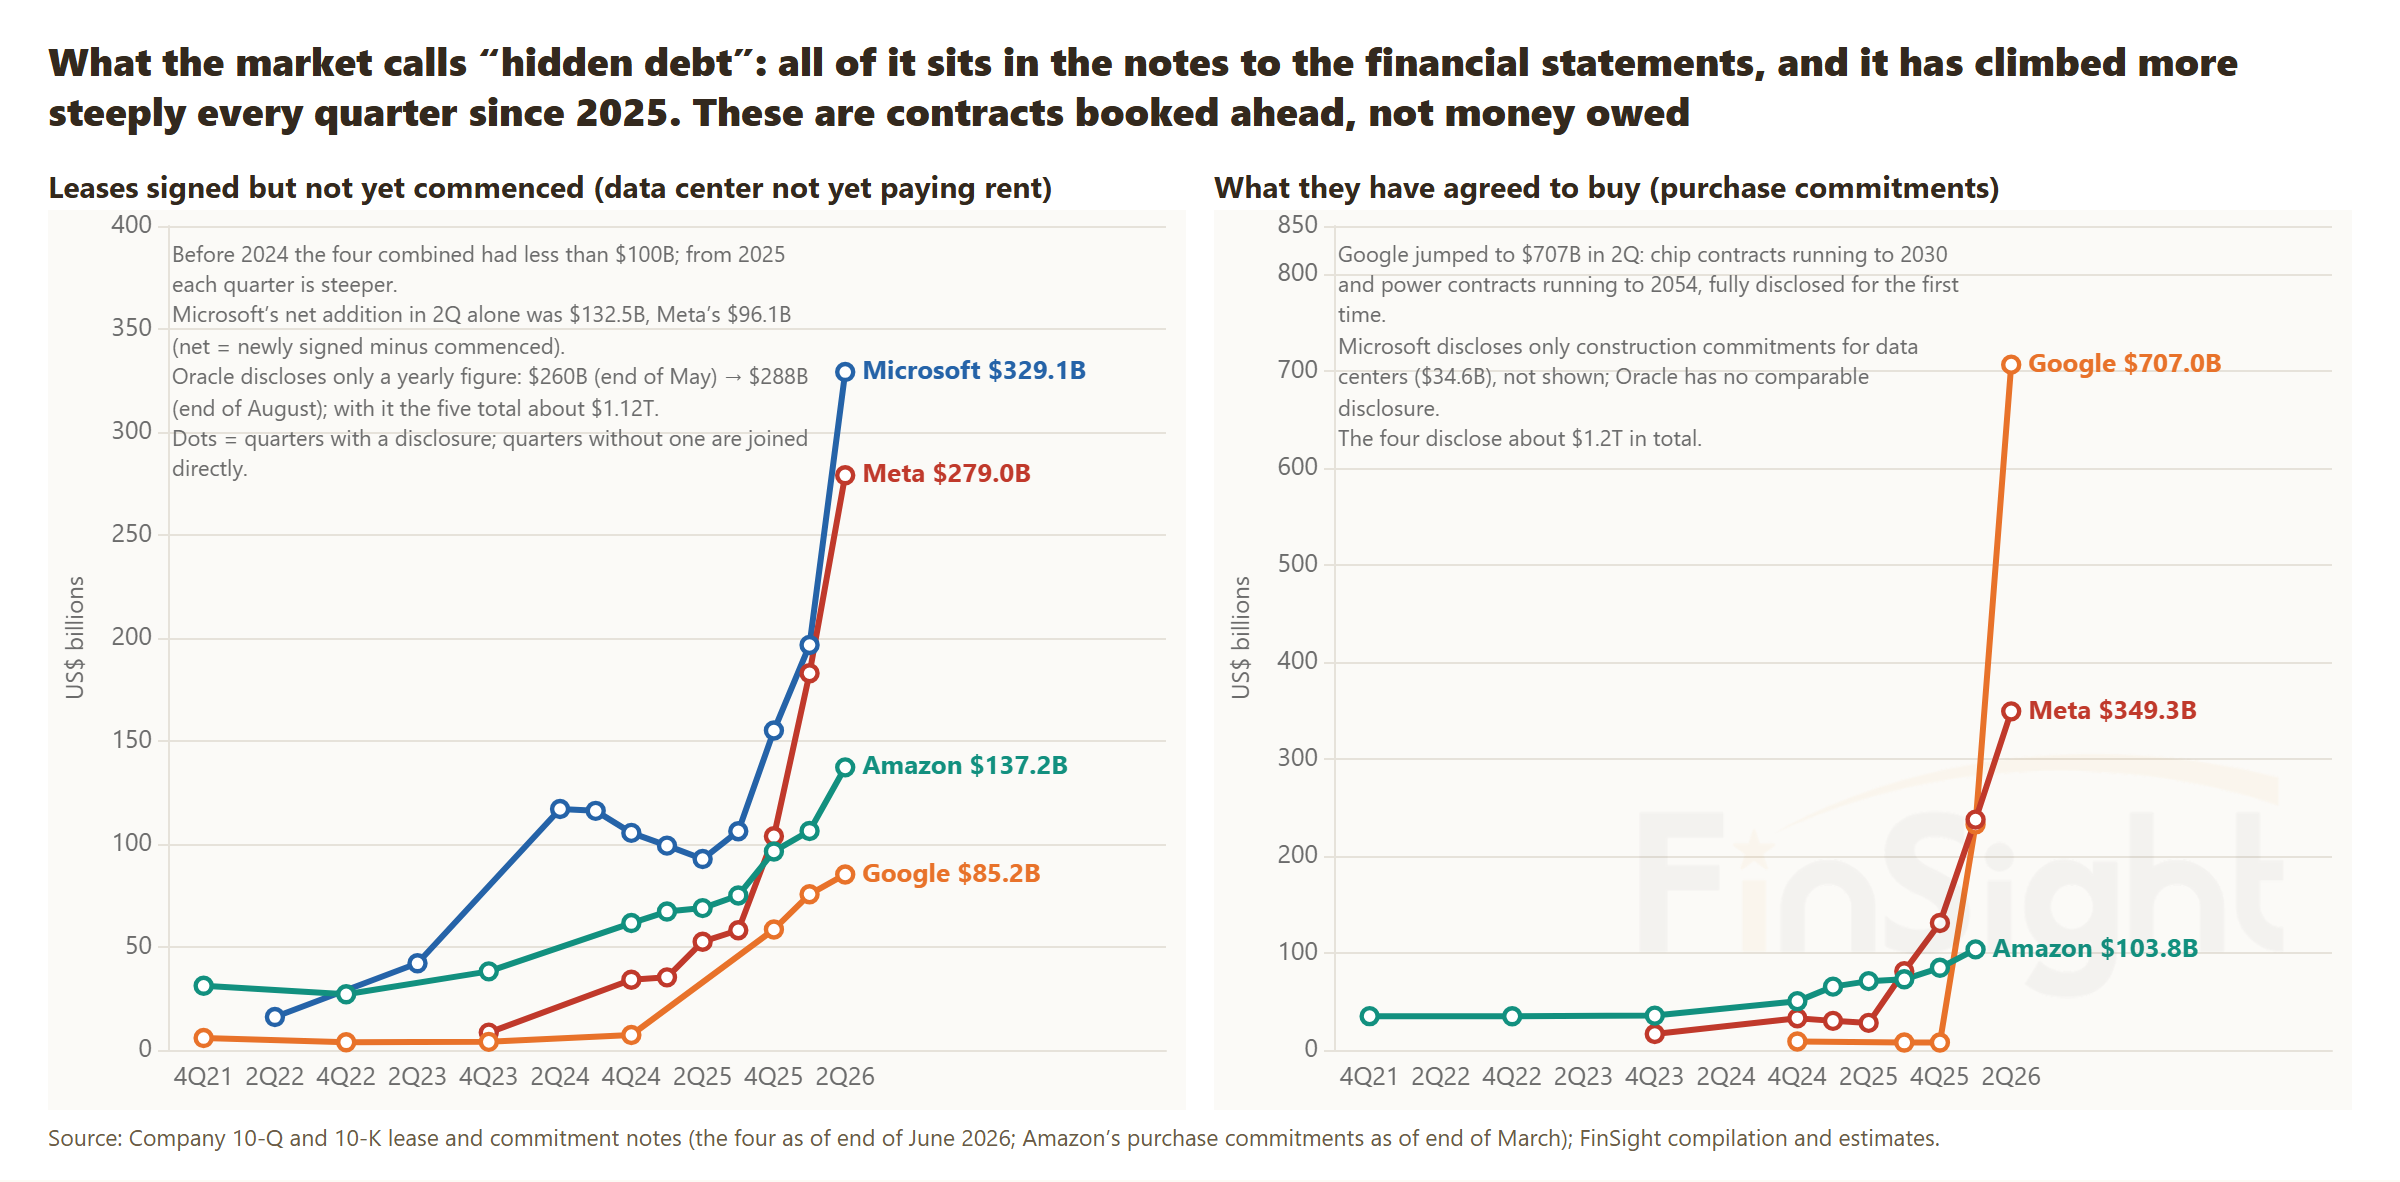
The notes are part of the financial statements, and anyone can look them up. Nothing is hidden. It is just harder to see. And the leases are rent due over 15 to 20 years, not money already borrowed. Once all $1.12T has commenced, the rent comes to roughly $60B a year. That is about 6% of the five hyperscalers' operating cash flow (the cash their businesses bring in) next year, an amount they can afford.
The commitments are this large because capacity is short. Chips, memory and power are all booked out into 2027 and 2028. To get them, you have to order early and sign long contracts. That is why Google has chip contracts running to 2030 and power contracts running to 2054.
Sums this large stay off the balance sheet because of the accounting rules. Leases that haven't commenced and purchases that haven't been delivered don't go on the balance sheet. They are disclosed only in the notes.
Why do some companies go out of their way to keep it out of reported debt, for example by leasing instead of buying, or by borrowing through a separate entity (what the market calls an SPV, a special purpose vehicle)? Because debt on the balance sheet feeds straight into the credit rating math, and the rating decides whether the biggest buyers, insurers and pension funds, can buy your bonds. The rating agencies don't just read the balance sheet, of course. They decide for themselves how much of the off-balance-sheet leases and guarantees to count back in. So the risk hasn't gone away. The debt load on the surface just looks lighter, and the borrowing terms look better. Oracle shows the cost of the debt it does carry in its own name: in July its rating was cut to one notch above junk. Many large bond funds cannot hold junk.
The market sees through the off-balance-sheet structures too, and charges for them in the interest rate. The bonds sold by the two separate entities set up to finance Meta's Hyperion and El Paso campuses cost 0.3 to 1.2 percentage points (30 to 120 basis points) more than Meta's own bonds of the same maturity. Meta attached a residual value guarantee, so lenders are mostly relying on Meta itself. That is why the debt is rated A+, just one notch below Meta's own rating.
Once booked, these commitments can't simply be cut. A signed lease is a signed lease, and long-term chip and server contracts are prepaid orders. Meta has even deposited $10.8B of cash into an account its purchase contracts require, money it can't touch until 2028 or later. Walking away from a half-built data center wastes more money than finishing it. So a large part of next year's spending can't be moved. What can move is spending that hasn't been ordered or signed yet. When the big four pull back, the first sign will be new leases slowing and unplaced orders getting pushed out, well before anyone tears up a contract already being paid. That is why, each quarter, we watch supply chain orders and the tone of the big four's earnings calls more than the total of the commitments.
How the circular deals work: supplier guarantees make borrowing cheaper, and everyone shares the loss when they fail
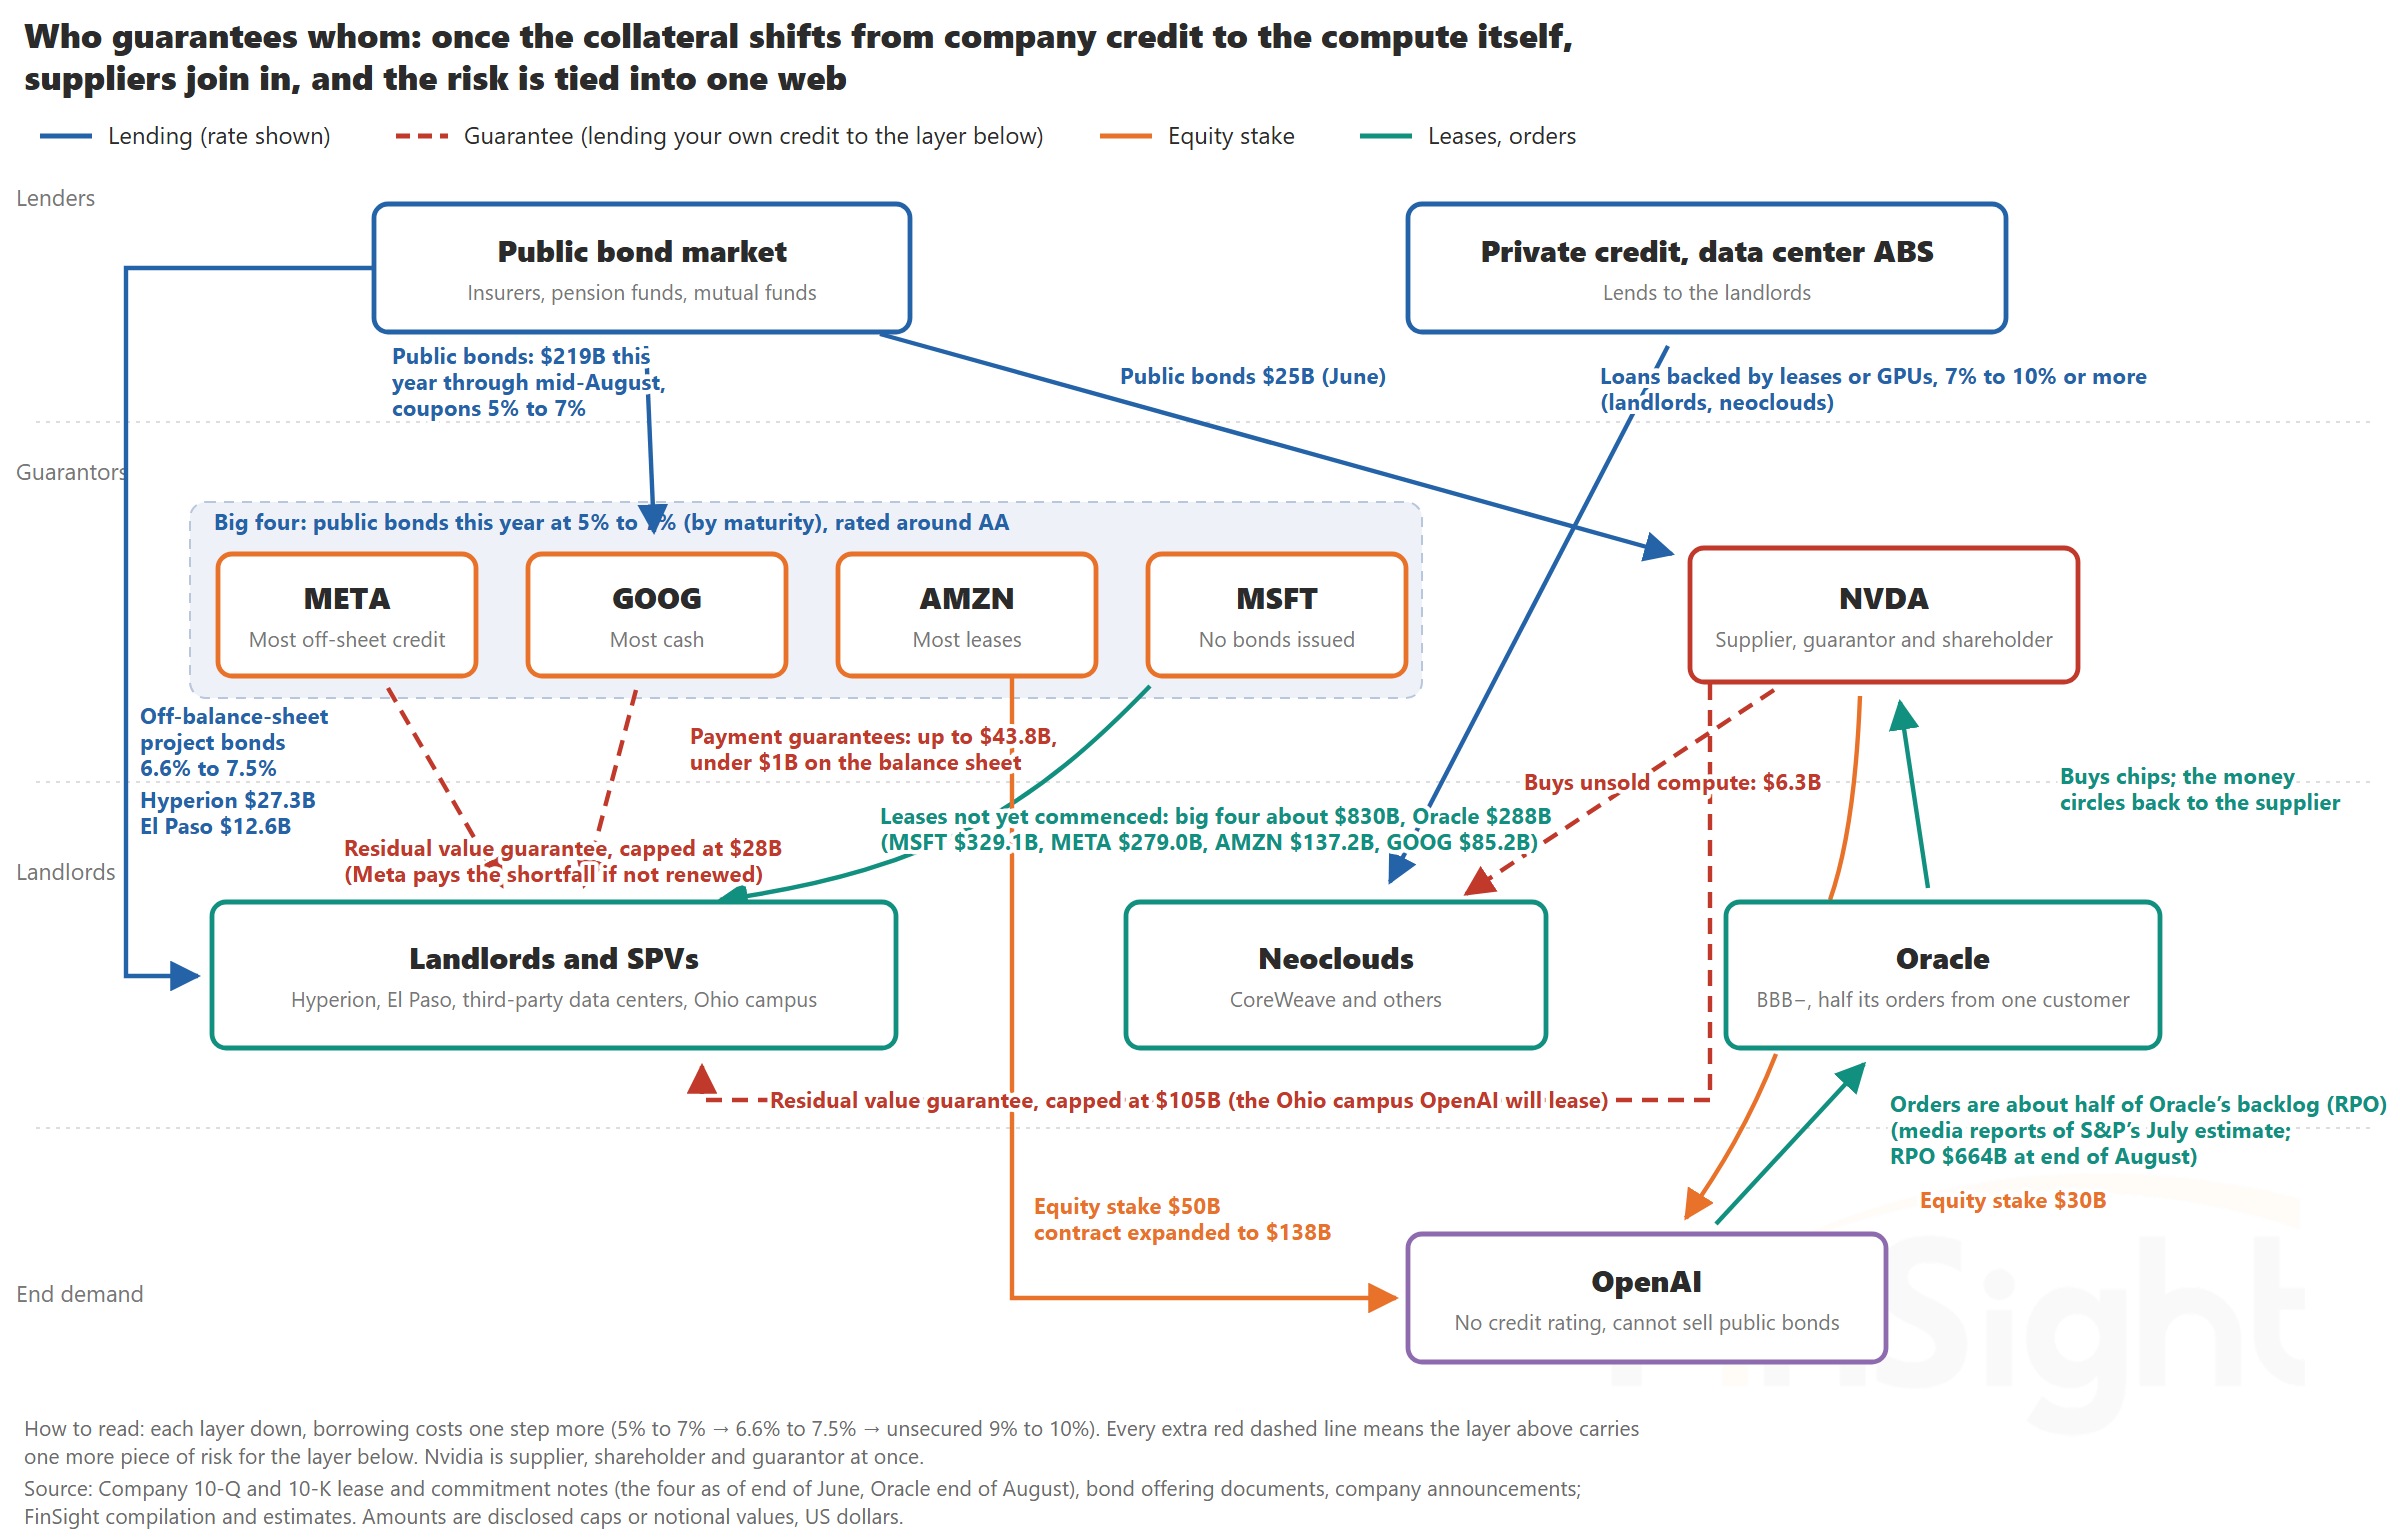
This is what the market calls circular deals: Nvidia invests in OpenAI, OpenAI signs a contract with Oracle, and Oracle buys chips from Nvidia. We put every stake, guarantee and lease we could find in public records on one chart.
Nvidia has invested $30B in OpenAI, and Amazon has taken a $50B stake. OpenAI accounts for about half of Oracle's backlog, the orders Oracle has signed but not yet delivered, and Oracle uses those orders to buy chips from Nvidia. Suppliers have also started guaranteeing their customers. Nvidia has given a residual value guarantee, capped at $105B, on the Ohio campus OpenAI plans to lease: if OpenAI can't pay and re-leasing or selling the campus doesn't cover the loss, Nvidia makes up the difference. Nvidia has also agreed to buy $6.3B of CoreWeave's unsold compute. Broadcom guarantees a customer's lease payments; the first such guarantee is capped at $29B. Google provides payment guarantees on third-party data center leases, which reached $43.8B in the second quarter.
Why do this? Because the business is so big that the landlords can't borrow enough on their own. Lenders want the party that will actually use the compute standing behind the loan before they lend at reasonable rates. Whether someone who can pay stands behind a loan makes a big difference to the interest rate:
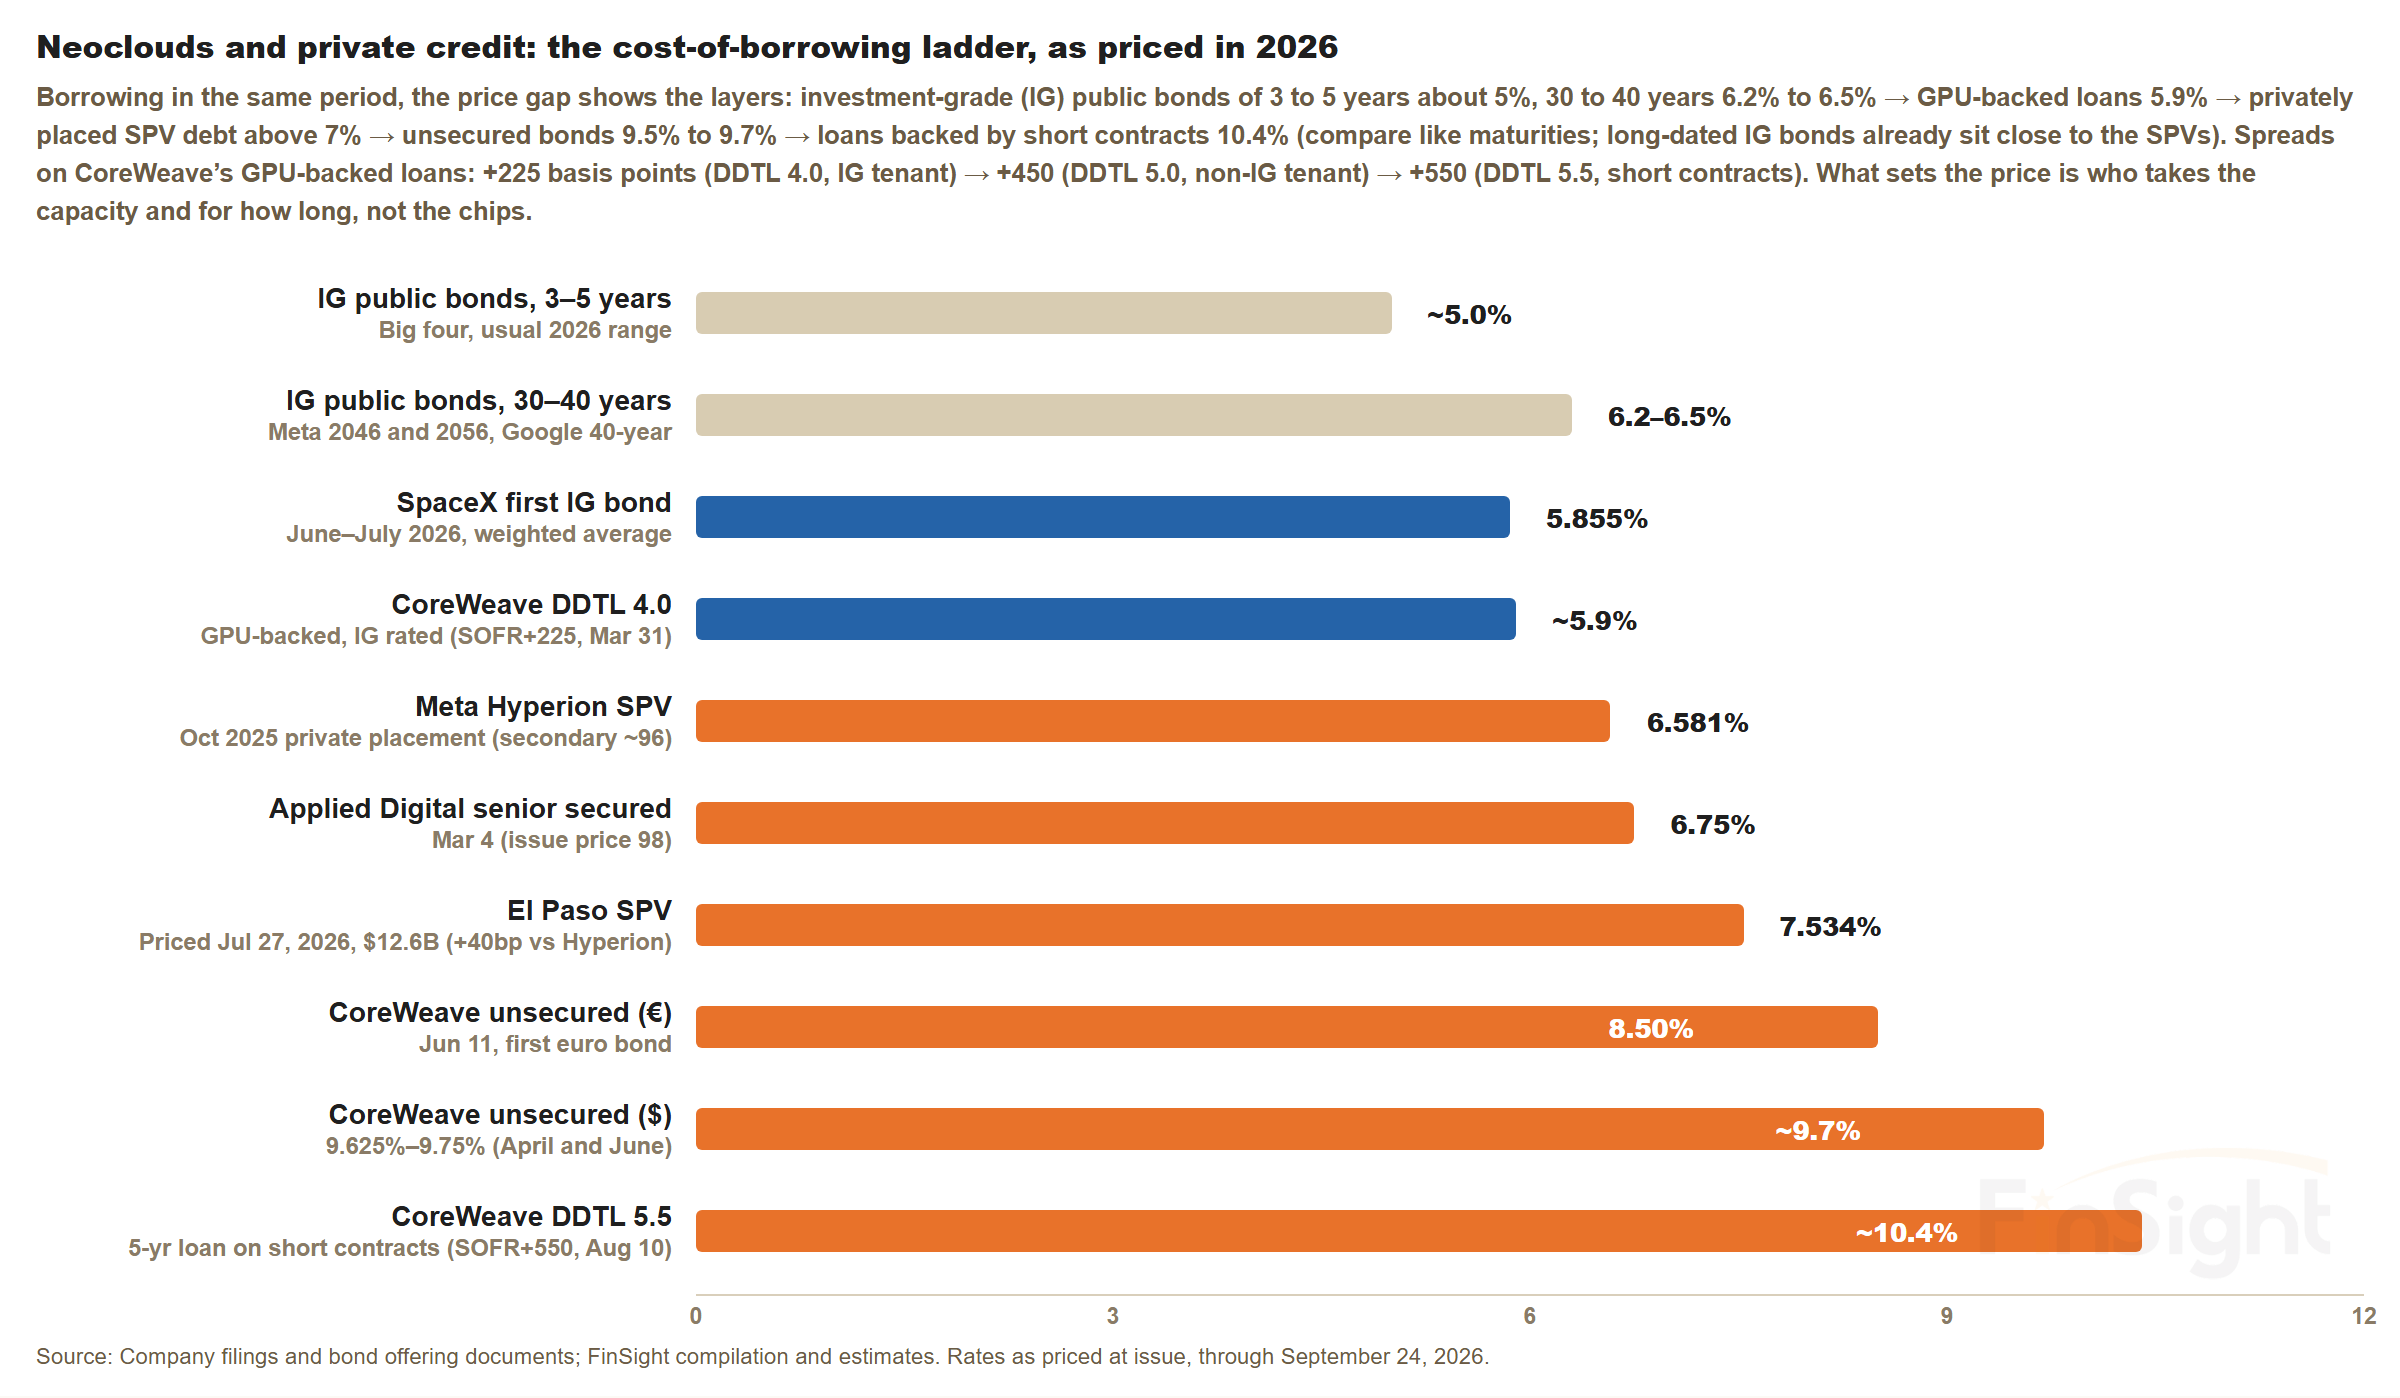
CoreWeave shows it most clearly. Same company, same year, interest rates from 5.9% to 10.4%. The loan backed by customers with investment-grade credit ratings (the safer tier) costs about 5.9%, within about a point of what the big four pay on their own bonds. The one backed by customer contracts that run out well before the five-year loan does costs about 10.4%. The chips are the same chips. The difference is who signed the contract and for how long.
When this structure works, every layer can borrow cheaply and compute gets built faster. But circular financing does not run on its own. Every trip around the loop needs a last stop where someone actually pays. When it doesn't work, the same company loses in several places at once. Take Nvidia: it sells fewer chips, its OpenAI stake loses value, and it has to pay up if the guaranteed campus can't cover its costs. So when things go wrong, the whole chain, from suppliers down to customers, shares the loss. That is what the market worries about most right now.
But the loss would not be shared equally. Throughout our 2026 posts on AI we have said it has to be looked at layer by layer, and debt is no different. As Part 1 showed, lenders are choosy: borrowers who can pay borrow easily and cheaply, and the rest pay more and more. The same logic holds when things break. The big four have operating cash flow to cushion them. The landlords borrow to build for others, so they feel it first when customers pull back, and Oracle is the most concentrated, with about half its orders coming from OpenAI. The last payers at the end of the guarantee chain are the AI companies that use the compute. Whether they can pay depends on their customers' revenue and their next funding round. That can be checked, and later in this post we hold it up against the numbers.
Why is the bond market worried? Bondholders earn only the interest, so a default is all they fear
In September 2025 Oracle announced its big contract with OpenAI. Its stock jumped that day. But since the start of 2026 the price of insuring Oracle's debt against default (a credit default swap, or CDS, quoted as a yearly cost in basis points of the amount insured) has climbed from 144 basis points (1.44 percentage points) to a record 215 at the end of July, the latest reading we use here. The higher the premium, the more bond investors worry that Oracle won't be able to pay.
Stock investors and bond investors look at the same thing from different angles. Bond investors earn a fixed coupon. If AI succeeds, the company does not pay them a dollar more; if it fails, they lose principal. So a default is what they watch for. Only shareholders get paid for growth.
A rising CDS is bond investors pricing insurance sensibly. It says they think the weakest layer deserves a higher premium, which doesn't mean stock investors should read it the same way. The bond market isn't always right either: Oracle's CDS set a record in July, yet its September earnings came in better than feared. So we don't treat the bond market as an early warning on its own. We read it as another crowd's opinion, alongside landlord prices, one that tells us which layer is under suspicion.
When the two markets disagree, neither is being irrational. They are charging different premiums for the same uncertainty, and the job is to work out which view the next numbers prove wrong.
Stock investors are nervous too. The S&P 500 trades at 19.1 times the next 12 months' earnings, down from 22.4 times a year ago and below its five-year average. When Google and Meta raised capex in the second quarter, their stocks fell 5% to 10% that day. For now the market punishes higher spending. But investors have not sold: in Bank of America's September fund manager survey, worry was up, yet owning semiconductor stocks was still the most crowded trade on Wall Street. After a stress test, we come back to what would make them move: a pause in capex.
If capex has to be cut, can the big four handle it?
Starting from the borrowing math in Part 1, we stress-test 2027: operating cash flow and earnings come in 10%, 20% or 30% below estimates, buybacks and dividends stop, and the whole gap is borrowed. Capex is either left unchanged or cut by 10%, 25% or 40% (debt here includes leases already on the books, as in Part 1; leases not yet commenced are not in it).
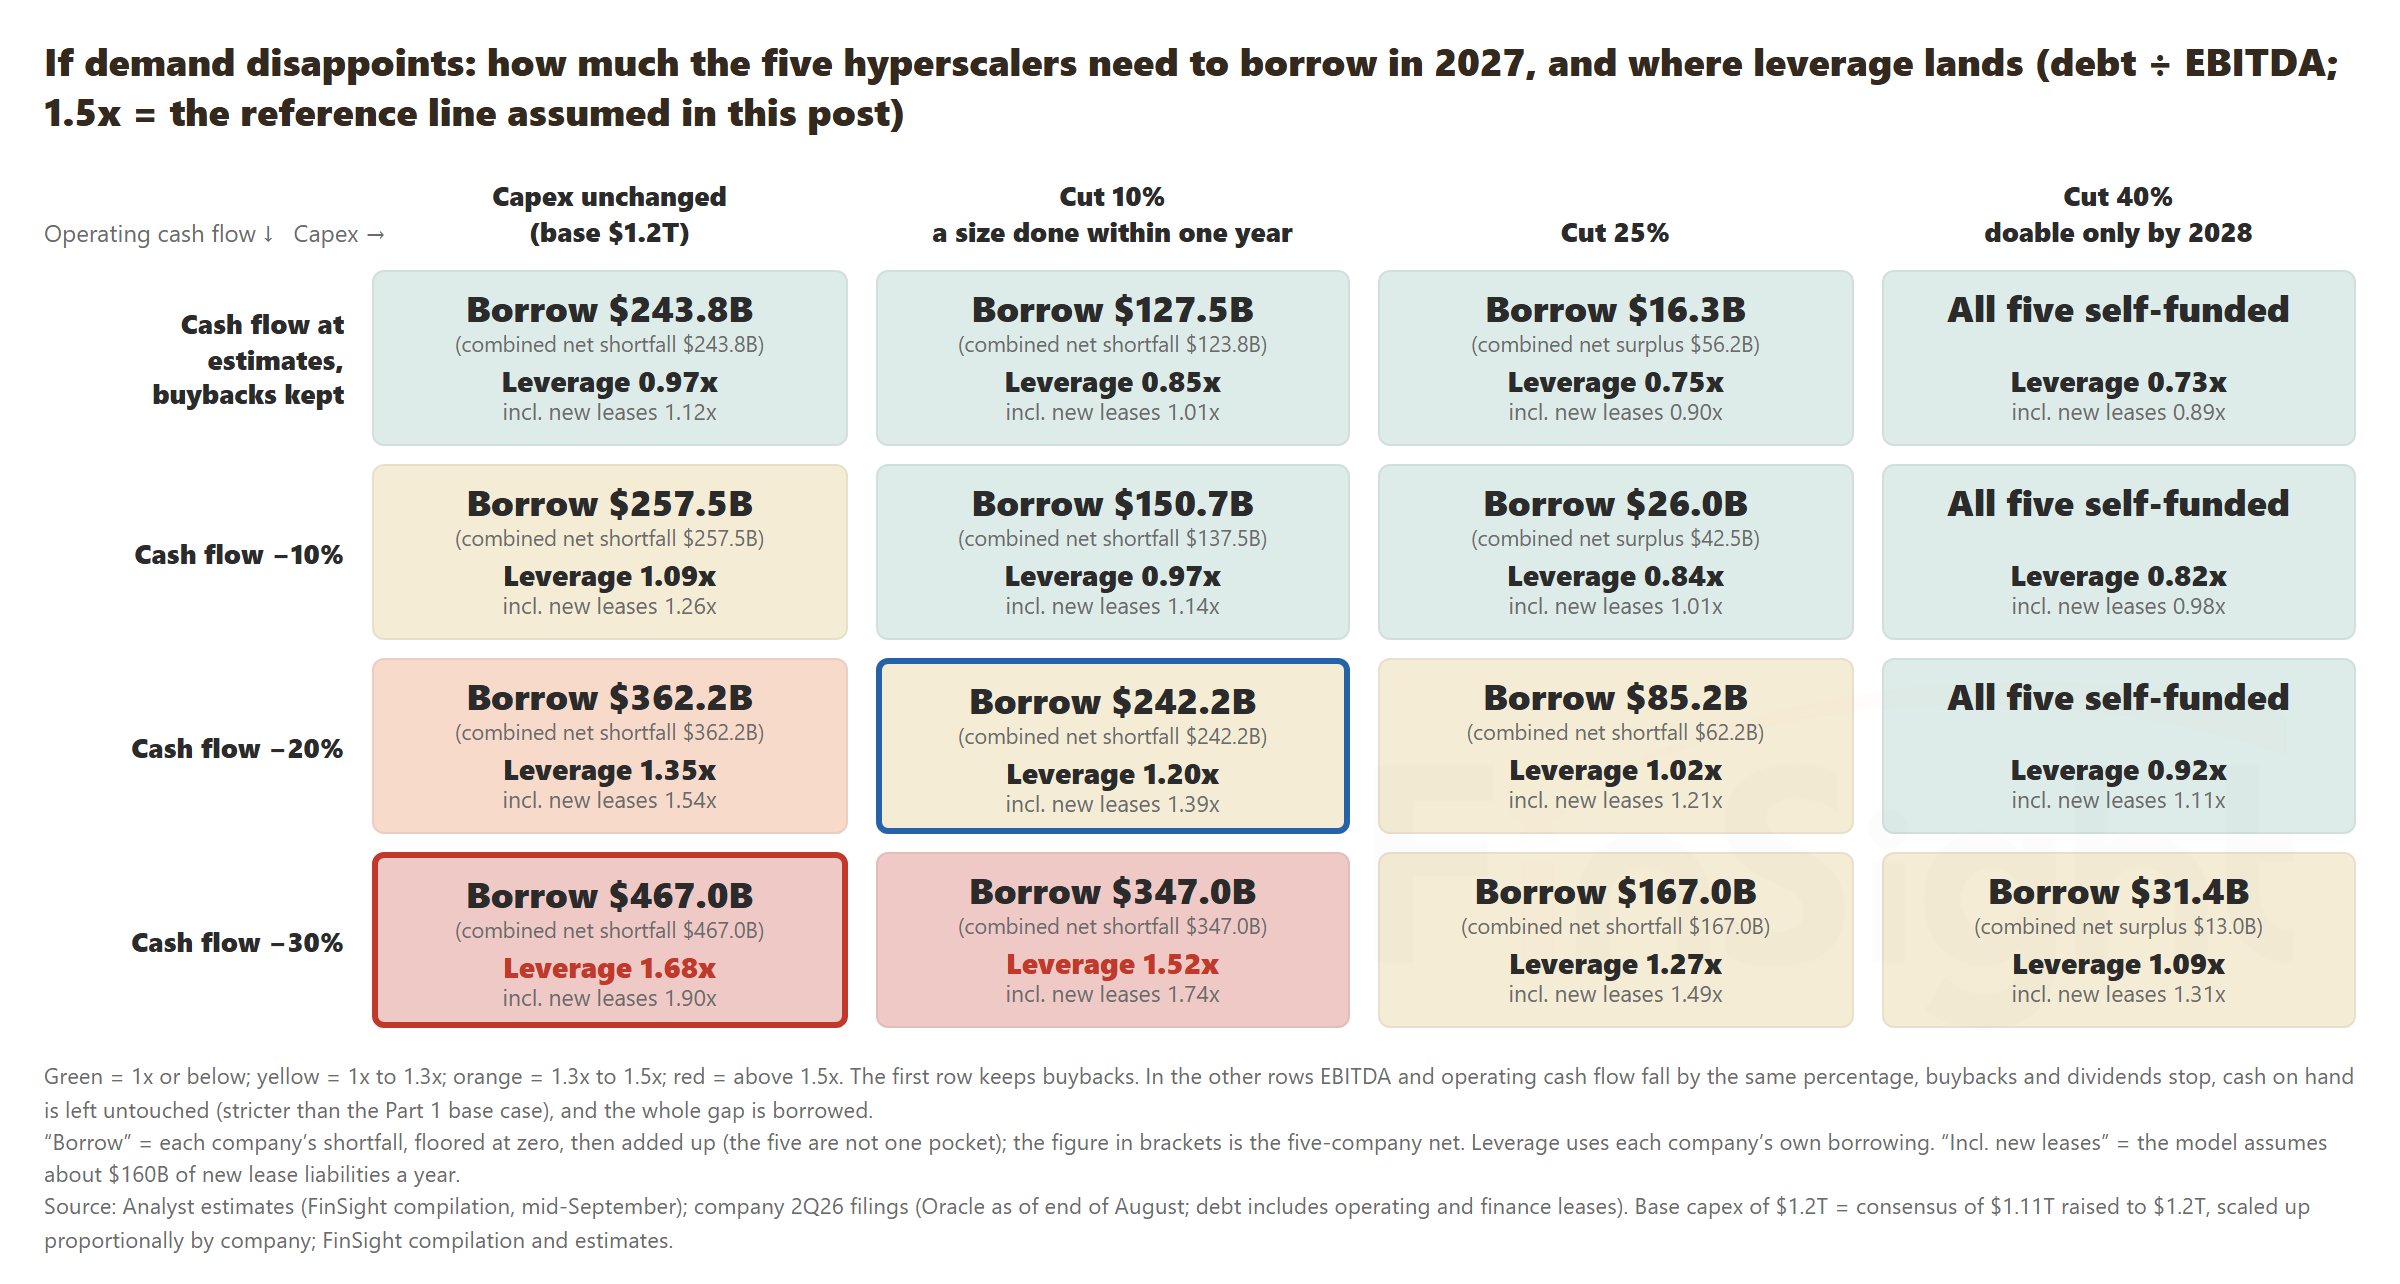
The two boxed cells are the ones to look at:
- The worst cell: cash flow down 30% and not a dollar of spending cut. The five hyperscalers combined would need to borrow $467B, and leverage (debt divided by EBITDA) would reach 1.68 times, above our 1.5 times reference line.
- The other cell: cash flow down 20% and capex cut 10%. The five hyperscalers combined would need to borrow $242B, and leverage would be 1.20 times, inside the line.
A 10% cut is a size they have actually made: in 2023 Meta cut its full-year guidance by 10%. But if cash flow falls 30%, a 10% cut still leaves the five hyperscalers combined at 1.52 times. The grid tests only 10%, 25% and 40% cuts; the 25% cut is the first that gets back under the line, and by the arithmetic a cut of about 11% would be enough. Company by company (Oracle is already over the line, as Part 1 showed), Microsoft is the most solid and Meta is the first of the big four to hit the line. Meta is also the heaviest user of off-balance-sheet borrowing vehicles and residual value guarantees, which helps explain why it hits the line first.
With cash flow down 20%, a 10% cut keeps the five combined comfortably inside the line, and among the big four only Meta would need a somewhat deeper cut. For shareholders, though, the growth story is gone, buybacks stop, and the signed leases still have to be paid. The bonds could be fine while the stocks fall. And a 25% cut by the five hyperscalers combined would take about $300B out of suppliers' revenue, a hit they would feel directly.
The question the stock market really cares about: what would make the companies pause capex?
For stock investors, the key question is less who carries the loss when things break than what would make the big four pause. Cutting spending is the last stop. A pause shows up first, and stock prices react to it first.
To judge whether a pause is coming, we check how far along the five steps from Part 1 are.
The five steps follow the money downstream: customers pay, each chip earns more, cloud revenue grows with capex, operating cash flow outgrows capex, and free cash flow turns positive. The first three are evidence that the demand is real. The last two, cash flow outgrowing capex and free cash flow (the cash left after capex) turning positive, are results that must show up if the virtuous cycle holds. Right now we are at steps two and three.
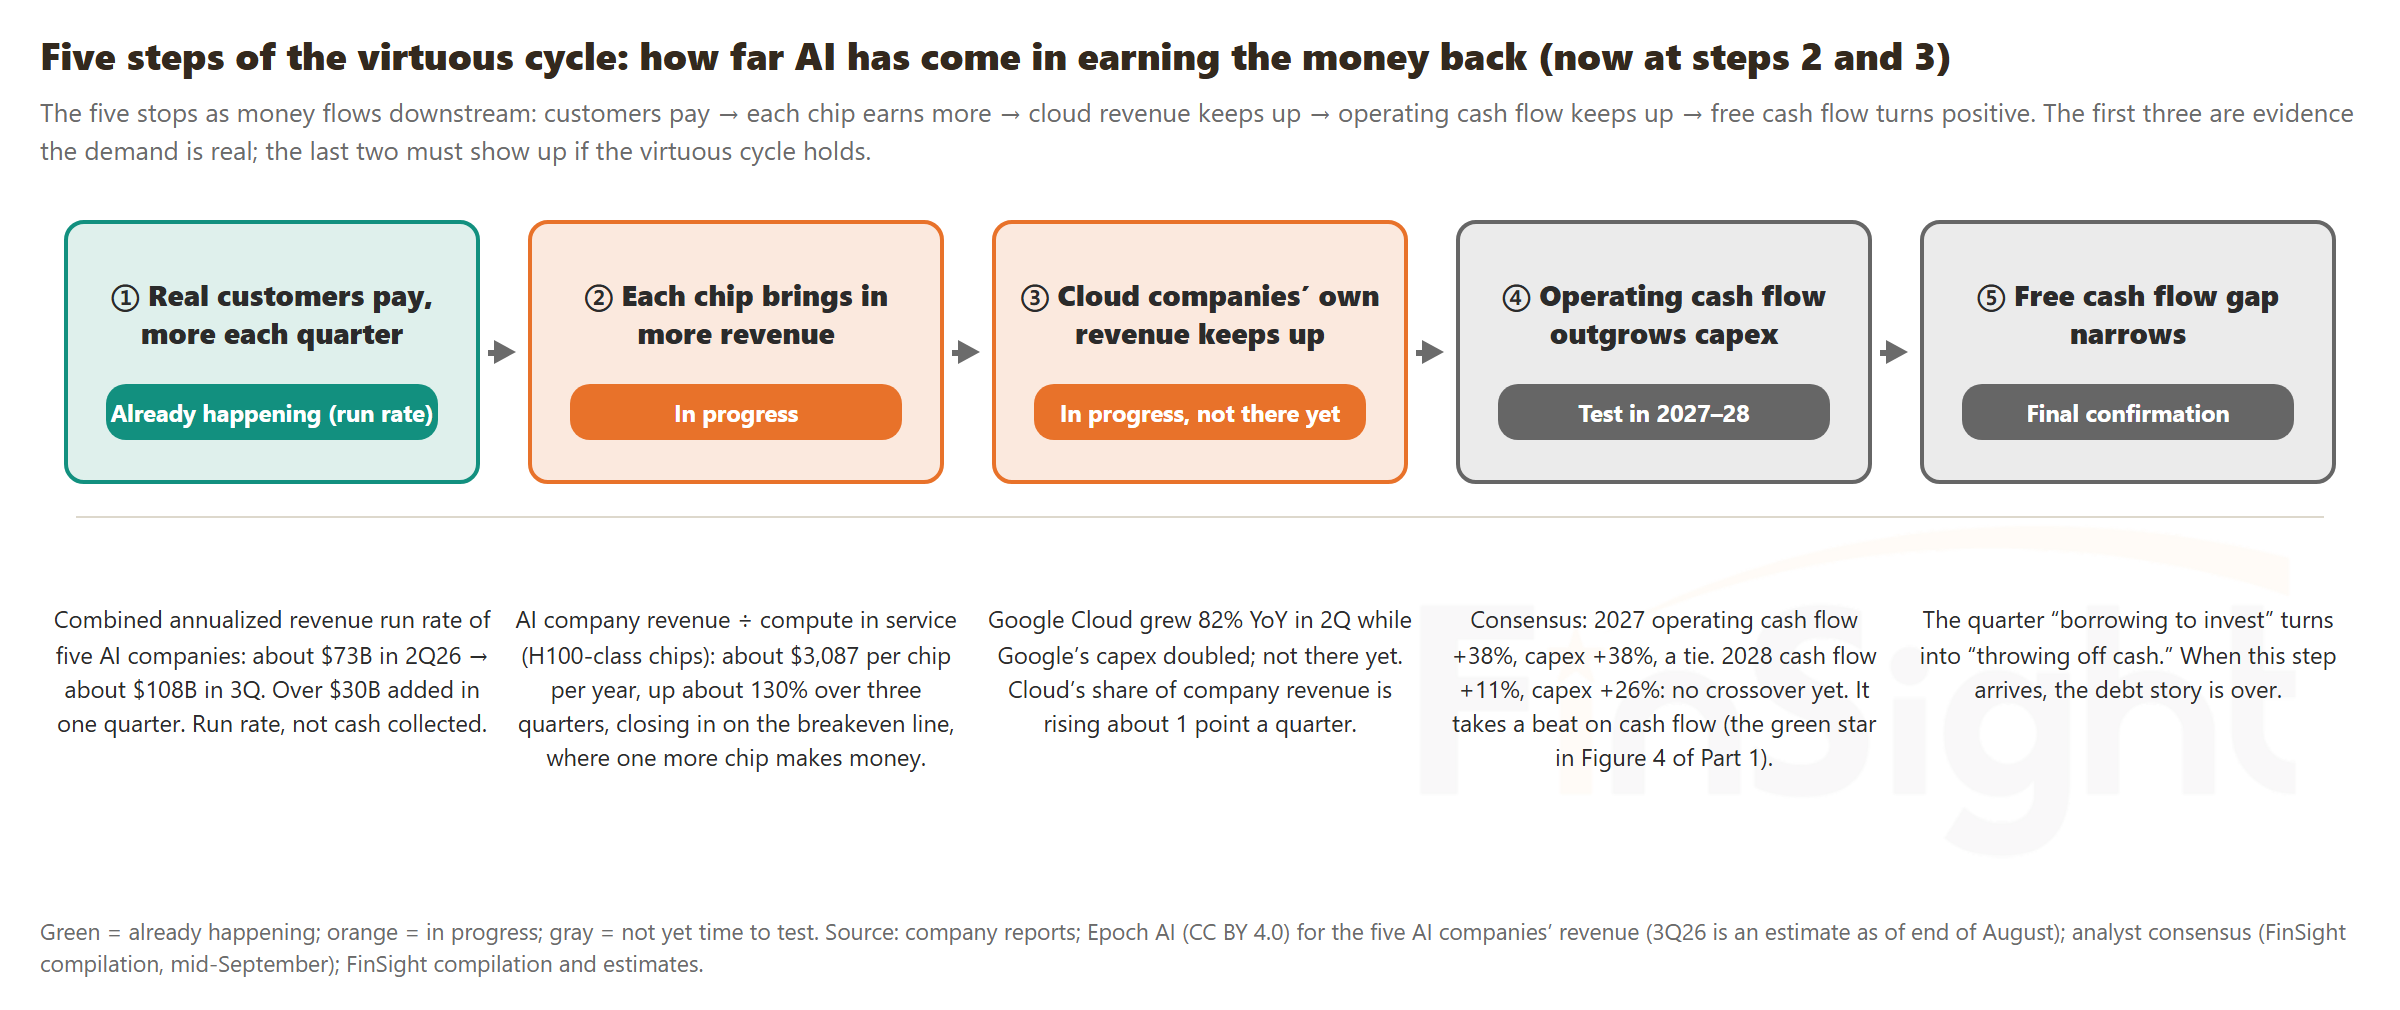
Which way the steps move matters a lot. Suppose the first three steps keep holding until step four arrives, and 2027 operating cash flow really does keep up with capex. Then the big four won't be forced to pause for lack of money, even if 2028 turns into a year of digesting new capacity. Whether they choose to pause because returns get worse still depends on the first three steps. If even step one goes backward, with customer payments shrinking two quarters in a row, this is no longer a routine pause to absorb capacity. Every later step would fall with it, and a pause would turn into a cut.
So step one matters most. It is also where the last payer in the guarantee chain sits.
For this step we now have a plan to check against. In mid-September the Financial Times reported on a presentation OpenAI gave its investors: revenue rising from $36B in 2026 to $350B in 2030, for $840B over the five years. Compute spending over the same period adds up to $856B. Revenue falls $16B short of the compute bill alone; after everything else the company spends, free cash flow over the five years comes to negative $278B, the company's five-year cash burn. The $122B it raised in March 2026 is expected to run out in 2028.
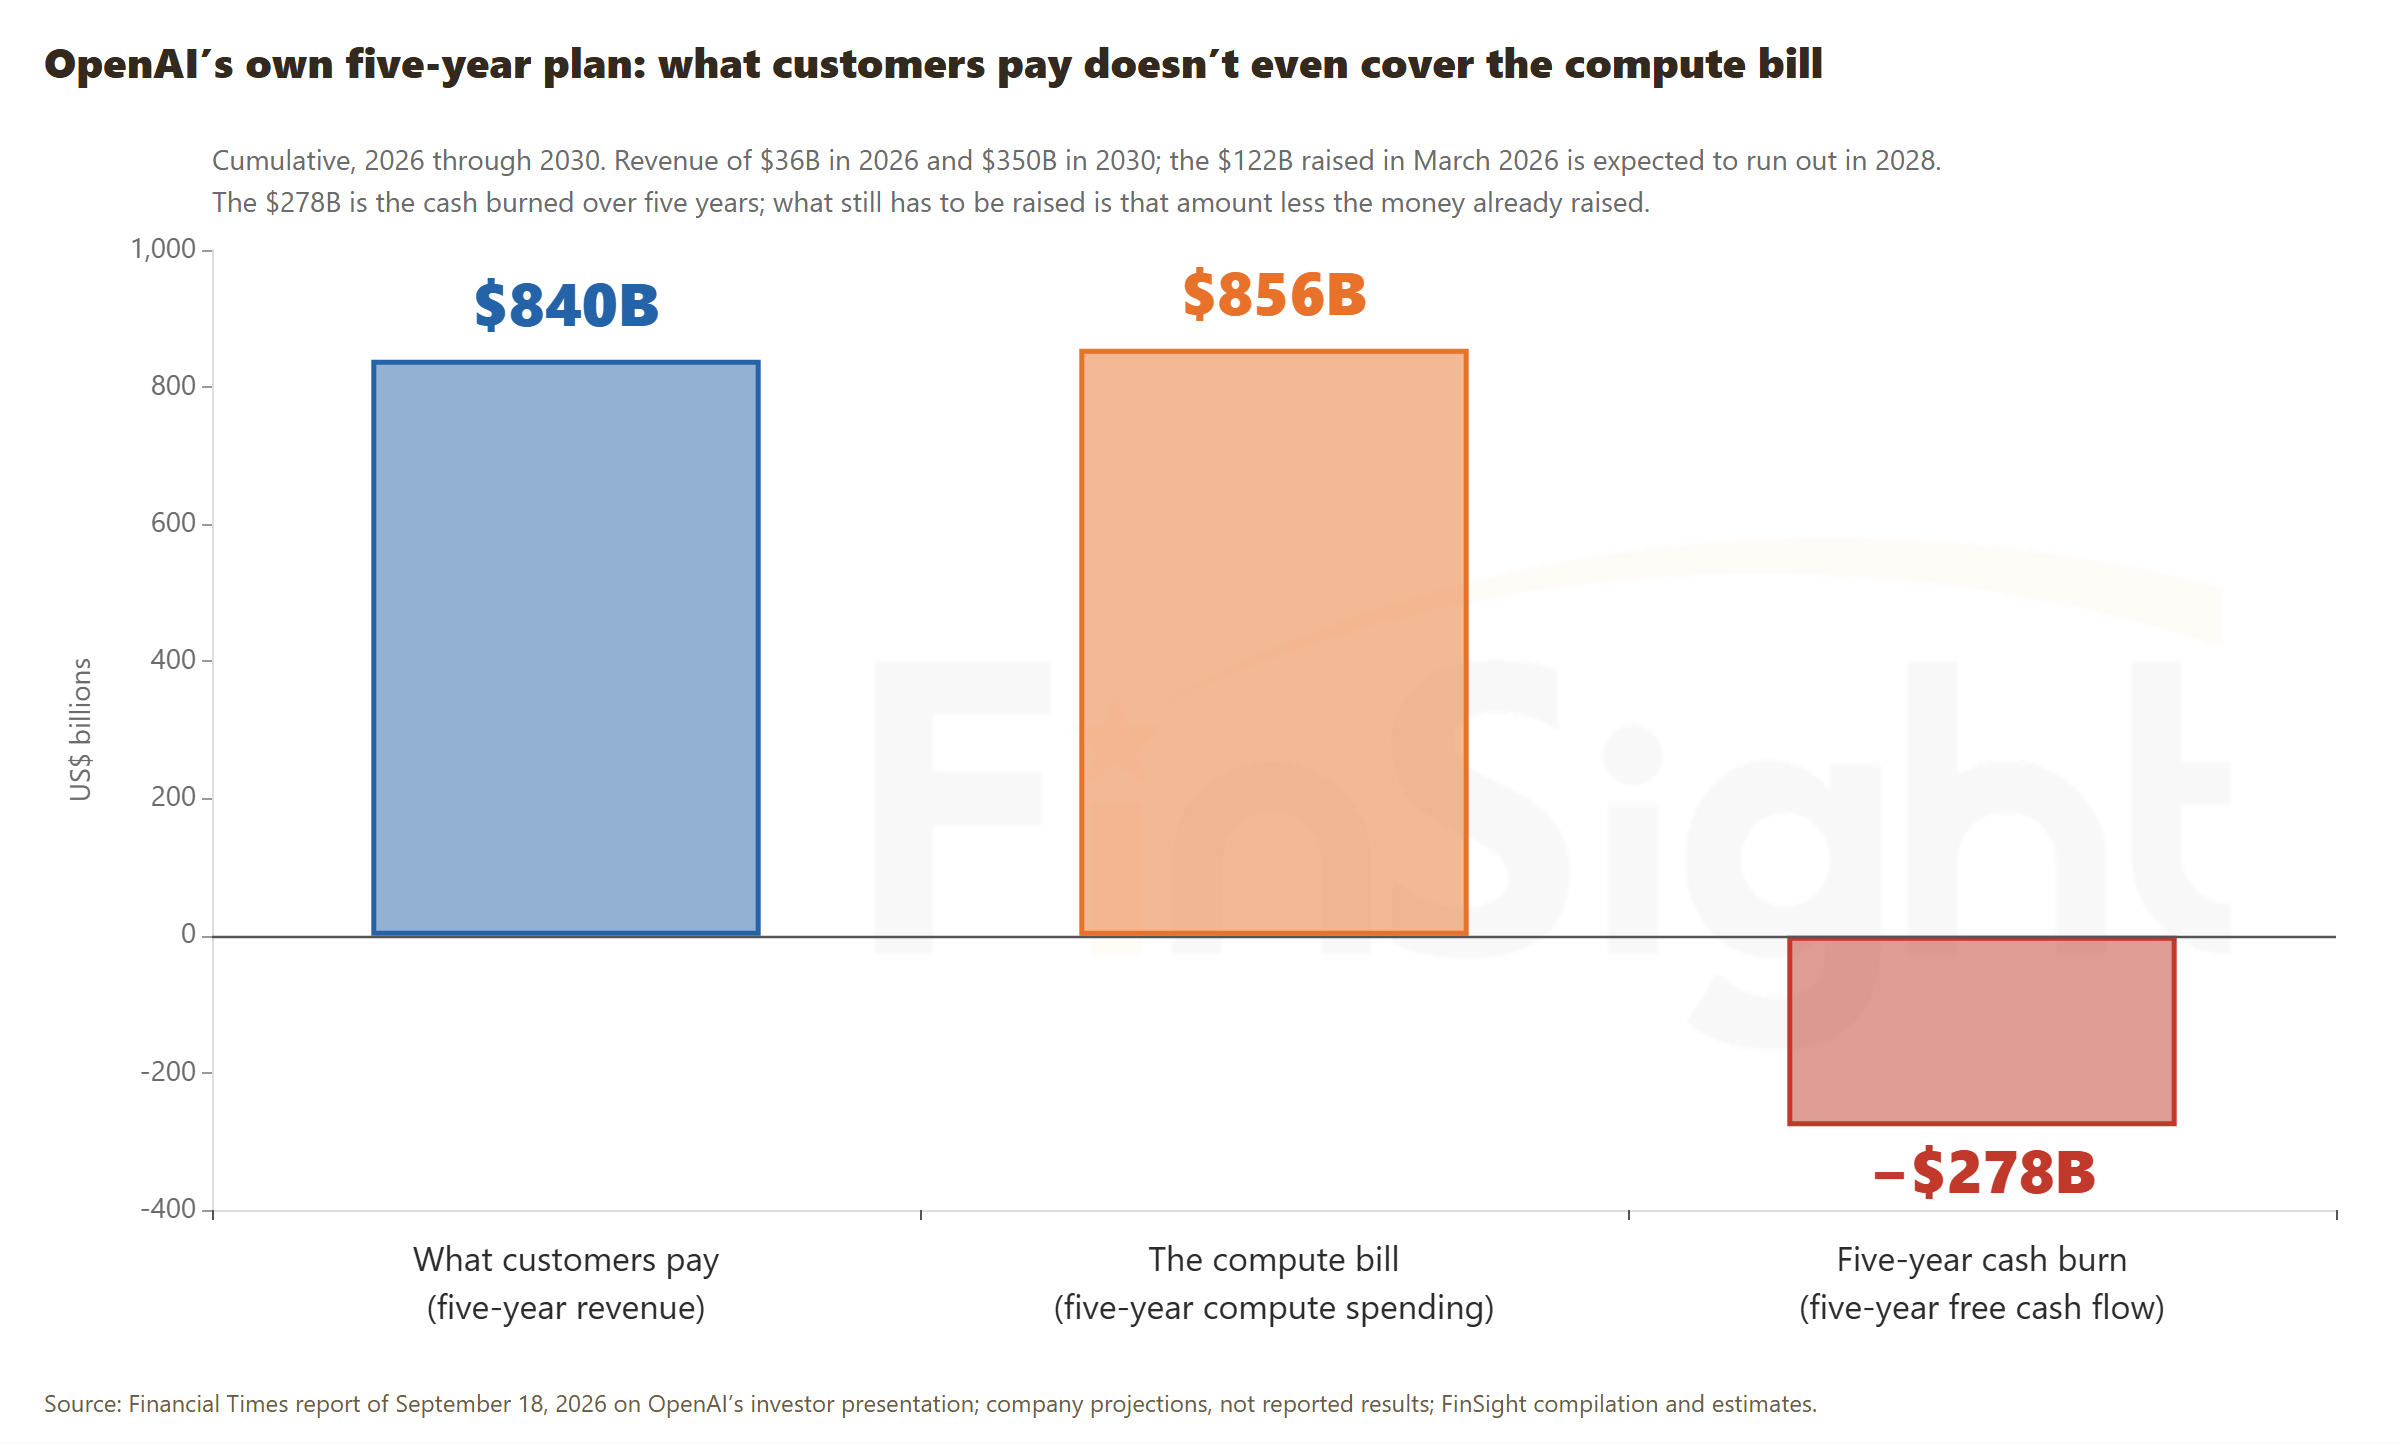
The gap has to be filled by raising more money, and a large share of it comes from the same suppliers shown in the who-guarantees-whom chart.
OpenAI is the weakest link in the whole structure, but it can be checked. Each quarter, hold OpenAI's actual revenue up against this plan. If revenue runs ahead and the compute bill doesn't rise along with it, the hole to fill gets smaller. If revenue falls behind, the hole gets bigger, and the ones filling it are the suppliers themselves. Across the AI companies we track, OpenAI among them, combined annualized revenue (the latest month's revenue times twelve) was about $73B in the second quarter and is already around $108B in the third. Demand is still accelerating, and we will check each new data point as it comes out.
If things really do turn, in what order would the signals appear? Putting together what we've covered, this is the order we expect:
- First to move: prices at the landlord layer. Rents on older chips soften first, and gross margins at the neoclouds slip. Around the same time, the bond market would show it too: CDS prices on Oracle and Nvidia rising, the same event seen by a different crowd.
- Next: the big four pause capex. Guidance stops going up, earnings calls start talking about "supply and demand coming into balance" and "digesting earlier orders," and orders at server assemblers and memory makers slow first. At this point the capex numbers in the earnings reports may still be rising, because the signed contracts still get paid.
- Last: a cut to spending. For the first time in this cycle, the big four's capex guidance comes down for real, not because of an accounting change like the one behind Microsoft's apparent cut in the second quarter (see Table 2).
The stock market cares about the first two stops. By the time the third arrives, stock prices have long since reacted. That is why we watch rental prices for GPUs (graphics processing units, the chips that run AI), earnings from companies such as CoreWeave, what the big four say on their earnings calls, and supply chain orders, instead of waiting for guidance.
| What we watch | Light now | Where it stands | What changes the light |
|---|---|---|---|
| GPU rents and landlord profits | Green | Allocations of the newest chips are booked into 2027, and rents have not softened; CoreWeave raised prices in July | Yellow if rents on older chips fall first and landlords' gross margins decline two quarters in a row |
| What the bond market thinks of the weakest layer | Yellow | Oracle CDS a record 215 basis points at the end of July; Nvidia about 80; the extra interest companies pay over Treasuries is near three-year lows | Red if Oracle reaches 300 basis points and Nvidia rises above 100; green if Oracle falls back below 120 |
| Whether the big four are pausing: guidance and supply chain orders | Green | In the second quarter Google and Amazon raised guidance; Microsoft's apparent cut was really an accounting change; server assemblers' shipments are still accelerating | Yellow if guidance stops going up, earnings calls talk about "digesting earlier orders," or assembler or memory maker orders slow two quarters in a row; red at the first real cut to guidance |
Listed in the order the signals appear: prices at the landlord layer and the bond market first, the big four themselves last. Green = normal; yellow = moving the wrong way but not yet at the warning line; red = past the warning line. US dollars.
Source: Lights follow the readings on our AI financing dashboard and our hyperscaler capex dashboard; CDS as of the end of July, the latest reading we use here; rents as of mid-September; FinSight compilation; dashboard readings refresh daily, table readings as dated
Finally: 2028 is more than a year away, and each quarter's numbers will tell us which cycle we're headed for
On current data, several things converge around 2028. The data centers the five hyperscalers have booked start to be delivered next year, and according to the research group Epoch AI, which tracks large AI data centers, not many come online in 2027 and far more in 2028. The yearly depreciation charge on the machines bought from 2024 through 2026 (the cost of those servers spread over their useful lives) reaches its full size in 2028. OpenAI's cash, by its own plan, runs out in 2028. Amazon said on its earnings call that most of its 2027 capacity is already reserved and a good deal of 2028 is spoken for, though not all of it. And the supply chain is adding capacity on the strength of long take-or-pay contracts (pay whether you use it or not), with new memory, advanced packaging and electrical transformer plants also scheduled to open in 2027 and 2028.
In the early years, the question was whether all this could get built. From here on it is increasingly whether what gets built gets used: whether the data centers the big four leased have customers, and whether the supply chain's new plants get follow-on orders. If not, supply chain gross margins come under pressure, and stocks may react before the earnings reports confirm it.
But we are not going to say, today, that 2028 is sure to bring trouble.
Our core view hasn't changed: compute stays tight and gets tighter through the end of 2027, and annualized revenue per chip (counted in H100 equivalents, the industry's common unit for comparing AI chips) could reach the breakeven line, the point where buying one more chip makes money, by the middle of next year. We laid that out in our July 17, 2026 post, "Today's Price Hikes Are the Early Innings: AI Compute Gets Tighter From Here, at Least Through Late 2027", and our July 22, 2026 post, "AI Is Not a Money Pit: We Drew the Cost Line for AI Compute, and It Is About a Year From Paying Off". The numbers since then have come in above our assumptions, so for now the virtuous cycle is more likely than the vicious one.
Between now and the end of 2027, the numbers will come out quarter by quarter: whether AI companies' annualized revenue keeps climbing in steps, whether the landlords' profits keep improving, and whether compute keeps getting tighter the way we assume. Our warning lights will change with them.
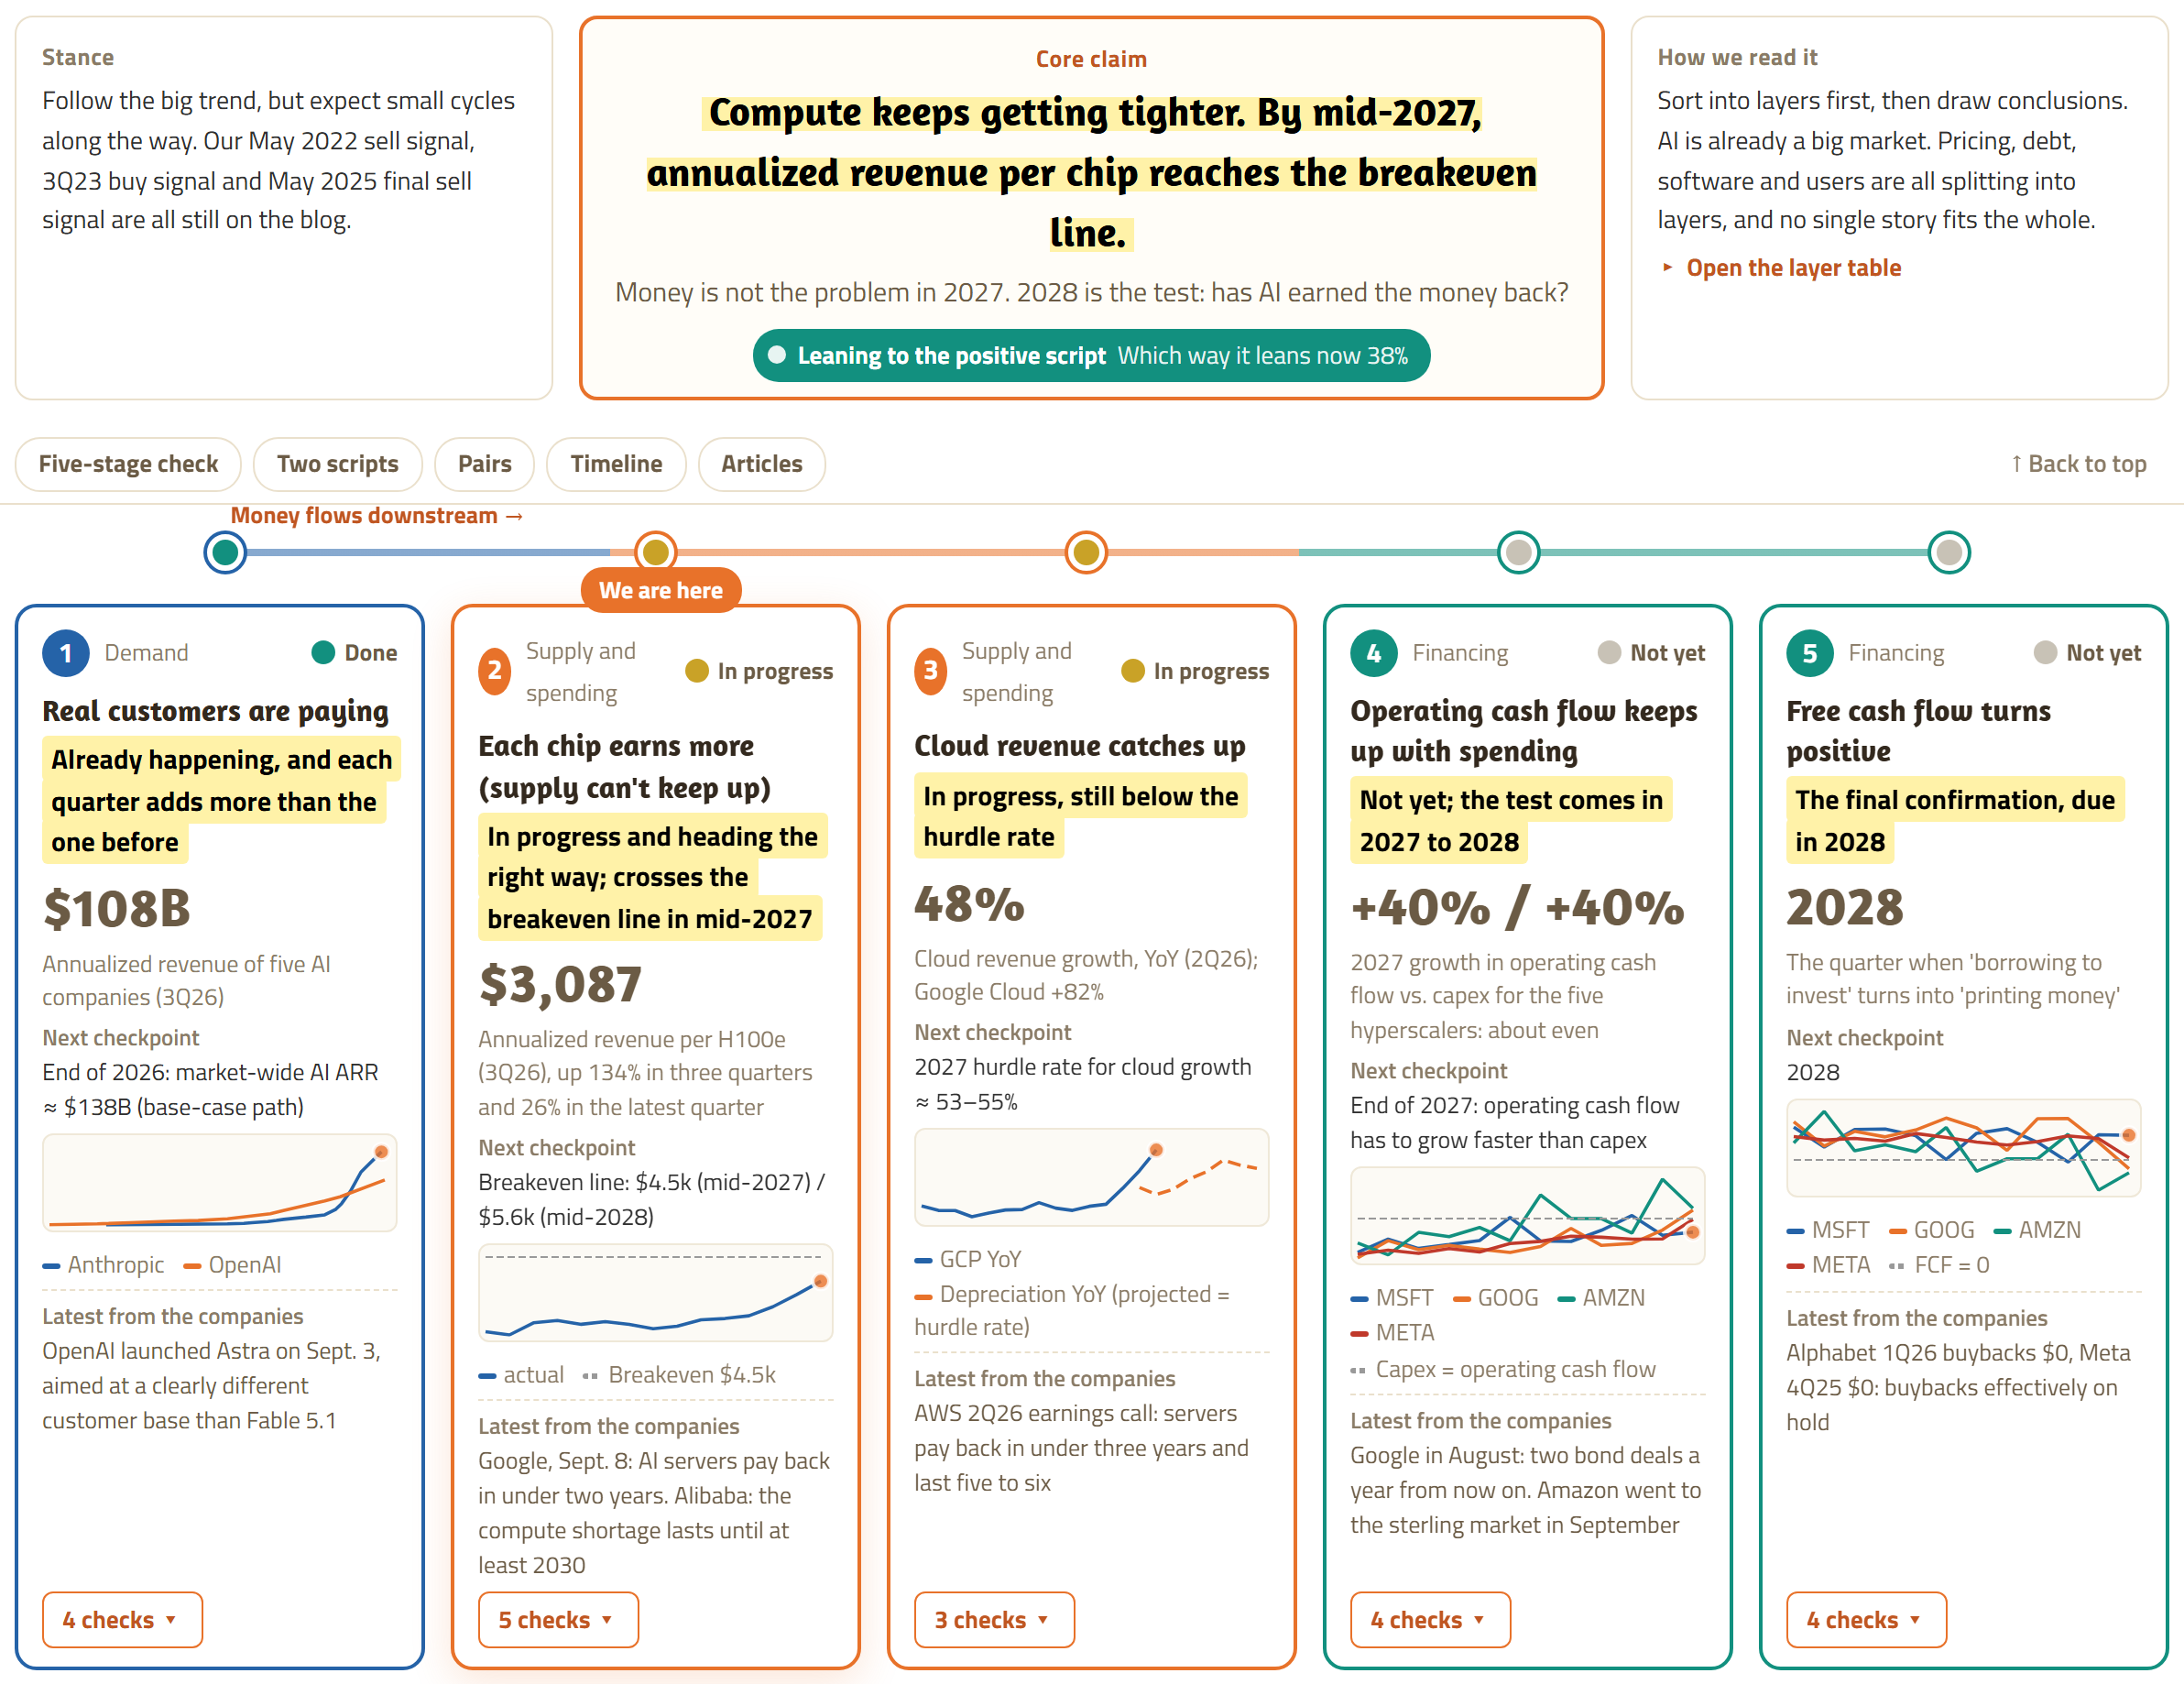
Both parts of this series did the same thing. The market takes one number, more than $2.3T of off-balance-sheet commitments or a 30-year Treasury yield at its highest since 2007, and draws a conclusion about the whole. We took each worry apart: what it is, whose books it sits on, and what would make it real, and left behind numbers that can be checked.
In an interview the week of September 21, 2026, Howard Marks of Oaktree Capital said the market is without question in a mania. But calling it irrational, he said, assumes you can calculate the intrinsic value of AI, and so far nobody can. Not knowing doesn't mean you can't act. The title of his 2001 memo says as much: "You Can't Predict. You Can Prepare."
That is also how we approach a technology revolution. We follow the big trend without assuming when it will top out, and we don't cling to any single number. We keep checking the numbers and adjust our view as new information comes in. The warning lights we set up across these two posts are our preparation.
We are about four years into this cycle. In the next post we look at how stocks behaved at the same point in past technology cycles.