
Taiwan's electronics inventory cycle has more room to run. We see the bull leg lasting into the first half of 2021, with the sector up 44.7% since August 2019.
In our April 2020 post on chipmakers restocking into the second half of 2020 we wrote that our research put us in a semiconductor bull cycle at least through the second quarter of 2021, and that an inventory correction was not a near term worry. This post starts from that inventory cycle work, adds macro indicators to sharpen it, and explains why we think the electronics inventory cycle has been extended into the first half of 2021.
Key takeaways
- The bull phase of the inventory cycle that started in the second quarter of 2019 has been extended. We expect it to run into the first half of 2021. Our sell signal, which fires when export growth and the PMI new orders minus inventories spread both turn negative, is unlikely before the second quarter of 2021.
- We are adding two macro series to sharpen the exit: Taiwan electronic component and ICT exports year over year, and PMI new orders minus inventories. Both are still healthy, with exports up more than 25% year over year.
- Taiwan has been through about two and a half inventory cycles since the PMI began in 2012: August 2013 to March 2015, when the TWSE electronics sector index (the electronics index) gained 28.3%, August 2016 to April 2018, up 22.9%, and August 2019 to today, up 44.7%.
- This leg is not a traditional one. It has already run longer than the usual one to one and a half years, and the 44.7% gain is well above the 22% to 29% of the past two cycles, which we put down to central bank liquidity.
Recap: two indicators for calling the turn in electronic components
Nobody doubts the long term uptrend in technology, but the swings in inventory can drive two or three years of volatility in the industry. That earlier inventory cycle work argued that two indicators do most of the work in calling bull and bear phases in electronic components.
- Inventory days year over year (when we say inventory days turn negative, we mean the year over year change goes negative, not the level): by the time inventory is clearing, the industry has usually been cooling for one to three quarters. A clear drop in inventory days says the industry is getting ready to start a new bull leg.
- Profit year over year: in a semiconductor upcycle, revenue, profit, inventory and investment all rise together, and that virtuous cycle cools off once profits at the makers start to look shaky.
Destocking, meaning customers working down the inventory they already hold instead of placing new orders, is a clean buy signal for semiconductors. Our sell signal has always fired late, so this time we are adding macro data to tighten it.
Two series do that work.
- Taiwan electronic component and ICT (information and communication technology) exports year over year: once that rate turns negative after adjusting for Lunar New Year timing, it is a cleaner sell signal than the net profit rule we used before.
- Taiwan PMI new orders minus inventories: the PMI is a monthly survey of purchasing managers, so it is a soft number and it moves with sentiment. Like the ISM in the US, its sub-indices are diffusion readings around 50, so new orders minus inventories is a spread, not a level.
One of those is a hard number (electronic component and ICT exports) and one is a soft one (the PMI new orders and inventories spread). Put together, they pair what companies think with what they actually ship.
Running both back over past cycles gives a fuller picture of the cycle logic and a clearer trading rule.
Adding macro data sharpens the read on Taiwan's electronics inventory cycle
Taiwan's manufacturing PMI, run by the Chung-Hua Institution for Economic Research (CIER) for the National Development Council, has only been published since 2012, so it covers about two and a half inventory cycles: August 2013 to March 2015, August 2016 to April 2018, and August 2019 to today.
Taiwan-listed companies file quarterly financials on a fixed calendar, so a buy signal from inventory days can only be acted on once the filings for that quarter are complete, and the PMI is released in the first days of the following month. Entry and exit dates below are the trading day after the signal is confirmed. What follows is a backtest, not a live record.
August 2013 to March 2015

- In the third quarter of 2013, inventory days turned negative year over year, and PMI new orders minus inventories had already turned positive in July. (Once the third quarter 2013 filings were complete and the year over year buy point was confirmed, we would go long on October 16, 2012.)
- In the third quarter of 2014, inventory days started turning positive year over year. Prices took a short correction, but there was still another leg up after it. The inventory build is not the tell. Order growth is.
- After the February 2015 PMI was released, new orders minus inventories turned negative, confirming the bull phase of the inventory cycle was over and an inventory correction had begun. The sell point was March 11, 2015, right after the PMI came out. (Electronic component and ICT exports then turned negative year over year in April 2015. Waiting for that export confirmation before selling would still have kept investors out of the 2015 bear market.)
- The gain over this leg, from the August 2013 buy to the March 2015 sell, was 28.3% (the shaded band on the chart).
August 2016 to April 2018
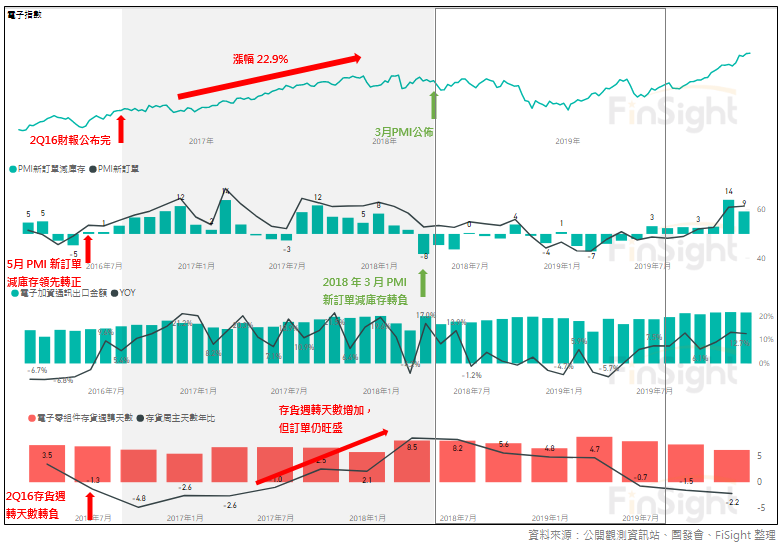
- In the second quarter of 2016, inventory days gave a bull signal, and PMI new orders minus inventories had turned positive first, in May. (Once the second quarter 2016 filings were complete and inventory days were confirmed negative year over year, we would buy on August 16, 2016.)
- In the third quarter of 2017, inventory days started turning positive year over year, but PMI new orders were still strong, so there was another leg up after that.
- After the March 2018 PMI, the bull phase of the inventory cycle was confirmed over and the correction began. The sell point was April 11, 2018. Prices then chopped sideways and started correcting at the end of 2018. (Electronic component and ICT exports turned negative year over year in June 2018. Waiting for the export confirmation would also have kept investors out of the 2018 bear market.)
- The gain over this leg, from the August 2016 buy to the April 2018 sell, was 22.9% (the shaded band on the chart).
August 2019 to today

- In the second quarter of 2019, inventory days gave a bull signal, and PMI new orders minus inventories had turned positive first, in June. Once the filings were complete, the buy was August 16, 2019. (Our January 2020 post on the Taiwan electronics inventory cycle said we were in the early part of a bullish inventory cycle, which is why we were positive on the market as a whole.)
- Early in 2020 the pandemic hit out of nowhere. Prices and new orders both corrected hard and then rebounded just as fast, and inventory stayed low the whole way through.
- As of today, the indicators we use to call the exit are still healthy. PMI new orders keep climbing, and Taiwan electronic component and ICT exports are up more than 25% year over year.
- The gain this time, from the August 2019 buy to today, is already 44.7% (the shaded band on the chart), far above the 22% to 29% of the past two cycles, and liquidity from central banks around the world is probably the reason.
What we take from reading the electronics inventory cycle
- Every bull phase of the inventory cycle starts from low inventory. The confirmed buy point is when inventory days are negative year over year. A full inventory cycle runs about three years: two years of bull and one year of adjustment.
- PMI new orders minus inventories leads the reported company inventory data slightly, and the PMI is published in the first days of each month for the month before, so it is useful for calling both the turns and the trend in the inventory cycle.
- When inventory starts building and inventory days turn positive year over year, order momentum usually keeps running for a while. The bull trend holds even as inventory days rise, but this is where the last leg up tends to be. (Demand is good, which is why makers want to keep building inventory. Once customers start double ordering, or demand weakens, the inventory correction starts.)
- In that situation, when order momentum fades enough to push PMI new orders minus inventories negative too, the bull phase of the inventory cycle is over and the correction is on. Taiwan electronic component and ICT exports turning negative year over year confirms it.
Bottom line: the inventory cycle has been extended, and the bull run should last into the first half of 2021
A bull phase of the inventory cycle usually runs about one to one and a half years, so this one should have peaked in the third or fourth quarter of 2020. Back in the first half of 2020 we were fairly worried about an inventory correction in the second half.
The pandemic changed that. It sped up the pace of technology adoption, and it pushed makers to build inventory rather than run it down. Inventory across the Taiwan electronics supply chain has stayed low, and that has stretched out the whole bull phase of the cycle.
Electronics makers have started talking about component shortages. Work from home demand, which we expected to fade after the second half of 2020, is now running into the first half of 2021 because the pandemic has not ended. Consumer hardware makers have also all launched aggressively priced products for the fourth quarter of 2020, so we still expect a good fourth quarter selling season.
This inventory cycle started in the second quarter of 2019. The pandemic caused a short correction in the middle of it, but inventory and orders both look fine right now. In the PMI data, production and exports are accelerating, inventory has only just started to build, and new orders are still strong.
One more thing to watch: the first quarter of 2020 was a stretch of both low new orders and low inventory, which pushed inventory days sharply higher. Because of that low base, we expect inventory days will have a hard time turning positive year over year before the first quarter of 2021.
In other words, the bull phase should extend another two quarters, and on cycle timing the sell signal may not show up until the second quarter of 2021.
We are not going to put a date on the top. We will keep watching the Taiwan macro data to judge when the bull run ends.
Expect to hear more about shortages and price increases across electronics from here. Watch for double ordering. That is what ends these cycles. When the sell signal fires, we will flag it.