
The Nasdaq fell as much as 13.4% off its high. Q2 2020 tech operating income was down 3% against down 36% for the market, so the re-rating case holds.
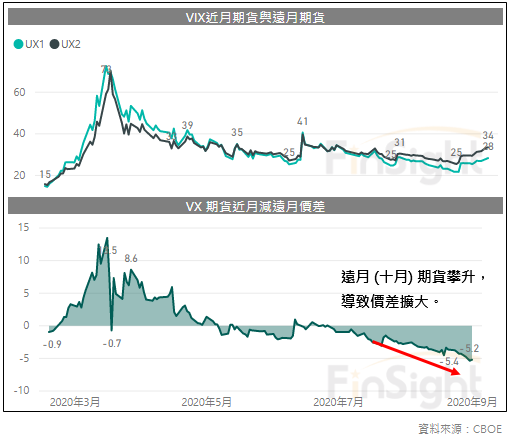
The market has spent close to a month pulling back, and the Nasdaq is down as much as 13.4% from its high. In early September 2020 we flagged on our Facebook page that the cost of insuring against a drop had jumped, with the VIX, the market's fear gauge, pricing later months far above the near ones. That pointed to heavy hedging into the November election and warned that short-term volatility was about to pick up. Honestly, the market still came down faster than we expected.
Key takeaways
- The two things that ended the Nifty Fifty in the 1970s are not in place yet. At the central bank symposium on August 27, 2020, Fed chair Powell said the Fed is willing to let inflation run moderately above 2% for a period, and the September Fed meeting signaled low rates through 2023.
- Second quarter 2020 operating income held up in a handful of sectors: technology down 3% year over year, health care down 1%, consumer staples down 6% and utilities down 1%, against down 36% for US companies in aggregate.
- Software passed hardware this quarter to become the largest contributor to operating income inside the tech group, and US investment grade corporate bond issuance has already set a record above $1.3 trillion this year, which funds buybacks, dividends, capital spending and deals.
- Valuations are full but not a bubble on the 1970 or 2000 scale: forward P/Es are 34.57 for Apple, 32.24 for Microsoft, 31.73 for Facebook and 32.63 for Google. The swing factor from here is the fourth quarter consumer electronics season, with Apple's October iPhone launch as the test.
So is a decline this fast the end of the bull market, or a pullback after a large run inside one? This post lays out how we look at tech stocks given how the pandemic has played out so far.
The basis for a tech re-rating has not changed
For the past six months our approach has been to look for the few certain things inside an uncertain environment. We laid that out in our July 2020 post on the investment logic behind this tech rally.
The pandemic sped up tech penetration, and a lot of vendors hit targets three years ahead of plan.
With central banks flooding the system with money, we think the market has a shot at repeating the Nifty Fifty of the 1970s, when a small group of large growth names carried the index. Even with pandemic risk still on the table, money keeps flowing into the leaders in each pocket of tech. As concentration rises and the pandemic pulls industry penetration forward, those leaders get fundamental growth and a re-rating at the same time, a run where earnings per share (EPS) and the multiple both move up together.
The last section of that July 2020 post also flagged the two things that ended the Nifty Fifty:
- Inflation makes easy money impossible to sustain.
- Company growth starts coming in below expectations.
On the first, at the central bank symposium on August 27, 2020, Fed chair Powell said the Fed is willing to let inflation run moderately above 2% for a period in order to support the labor market and broad economic activity. At the September 2020 Fed meeting, the message was that low rates stay in place through 2023.
The market was not thrilled that the Fed did not expand quantitative easing. But with no liquidity problem in the market right now, confirming that low rates hold for a long stretch at least means policy is not turning on a dime. So we do not think this is something to worry about for a while.
And ample liquidity will keep hunting for whatever looks certain in an uncertain era.
On the second, we pulled together second quarter 2020 US earnings and found several areas growing better than the aggregate. On operating income, technology (down 3% year over year), health care (down 1%), consumer staples (down 6%) and utilities (down 1%) all beat the total for US companies (down 36%).
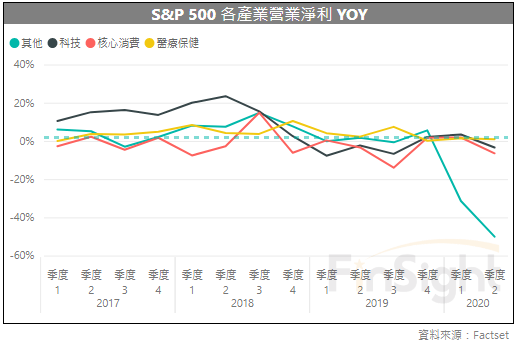
Three things stand out inside the tech numbers:
- The software era has arrived. Within the tech group as it is normally classified, software keeps taking share, and this quarter it passed hardware to become the largest single contributor to operating income. More and more services now run on the cloud and the network, every field is looking for a cloud transition, and both the enterprise and consumer sides are seeing structural change. Those shifts are showing up in company profits.
- Cash flow is exceptional. Cash flow across the tech group rose again this quarter. Plenty of quality companies are using the low rate environment to issue corporate debt and put more cash on hand. US investment grade corporate bond issuance has set a record this year, above $1.3 trillion, including Apple, Amazon and Google. When a company is sitting on cash it can do more: buy back stock, raise the dividend, spend more on investment, keep buying companies. We have already seen a wave of acquisitions, and we expect the sector to stay busy.
- The dispersion is wide, and it is not good news across the board. Inside all of this we see extreme divergence within industries. A small number of winners get better profitability, better cash flow and more capacity to invest or acquire and widen the moat, but the industry as a whole is not doing well. For example: semiconductor operating income shows no clear growth in aggregate, yet equipment makers see aggressive spending on advanced nodes. Handset unit demand is weak overall, yet 5G penetration in China keeps climbing. In high performance computing, Intel is seeing an inventory correction while TSMC, AMD and NVIDIA keep growing on new product launches.
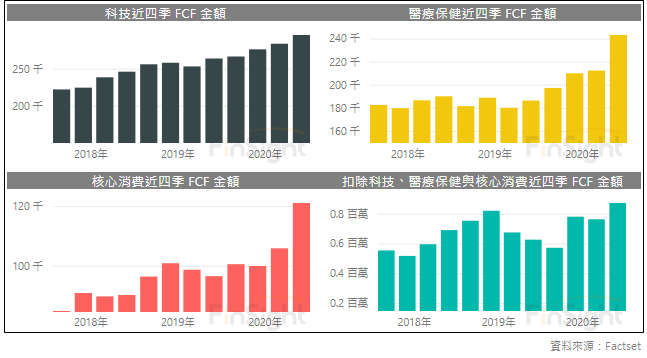
Step back to the big picture and we think profit growth in tech keeps running. Faster tech penetration, plus a small group of companies compounding cash flow and earnings, should keep the leaders posting steady profits.
With EPS growth underneath it, the multiple has room to keep expanding as long as the money stays easy.
How to handle a rally that has real fundamentals and some froth
Back in May and June 2020, when we started saying tech was heading into a bubble, someone asked us: isn't 'bubble' a negative word? Why use it for a move higher in tech?
To us, a bubble is the necessary evil of innovation.
While a bubble forms, asset prices move up fast, and that pulls in more and more people who come to believe in the story behind the trend. But a high multiple and heavily concentrated money cut both ways, and when the bubble starts to break, prices fall just as violently.
A good company can be a long-term buy with the trend running its way and still drag down your return if you buy it at a very expensive price. So beyond judging the direction of the trend, you have to pay attention to the entry point.
Take the Nifty Fifty of 1970 and the internet bubble of 2000. The businesses involved did keep growing afterward, but the stocks took a decade to get back near those highs. The business was fine; the entry price was not.
So when we make a bullish call on the tech leaders, we keep going back to check two things: whether EPS growth is durable, and whether there is too much froth in the P/E given how easy policy is. Then, based on your own investment style, you decide how hard to participate (how much of the portfolio to commit) in a move that gives you earnings growth on top of multiple expansion.
Tech valuations today are on the expensive side, but on the scale of the Nifty Fifty or the internet bubble they do not qualify as a bubble. Forward P/Es for Apple, Microsoft, Facebook and Google are 34.57, 32.24, 31.73 and 32.63. Those are not cheap, but in this policy environment they are still reasonable.
As a trend follower, we stay with that call.
The swing factor for tech stocks: this year's fourth quarter consumer electronics season
The market's outlook for tech now splits into two camps:
- The fourth quarter consumer electronics season disappoints, vendors have to clear the inventory they have built, and the pace of tech product upgrades slows.
- The work from home demand we see now runs into the first half of 2021, the pandemic keeps accelerating tech penetration, and component shortages push vendors to raise safety stock further.
We do not think cloud demand is a worry, because that structural shift is not going to reverse.
For consumer tech products, we do need to see the actual sales numbers when they come. But looking at the recent consumer electronics launches, hardware vendors are pricing aggressively and putting a lot of spec in the box:
- NVIDIA: the Ampere gaming GPUs did not raise prices while lifting performance sharply, and we are already seeing prior generation prices collapse in the used market with consumers lining up to buy.
- PS5 and Xbox: both priced below what the market expected, and priced at parity with each other this year. With people at home, the gaming market still has room to run.
The one hardware product that matters most is the iPhone Apple will launch in October 2020.
Working off the bill of materials, the Taiwan investment community has been worried that this iPhone will be priced so high that consumers cannot afford it. But look at Apple's strategy over the past two years and it has kept shipping products that deliver a lot for the price. Global handset units are down 10% this year, with high-end units notably worse, and with Huawei cut off from chip shipments by US restrictions, Apple should be looking to put out a strong value product and take share.
Based on the leaked pricing circulating in the supply chain, a large price increase from Apple looks unlikely, and the pricing even looks somewhat attractive.
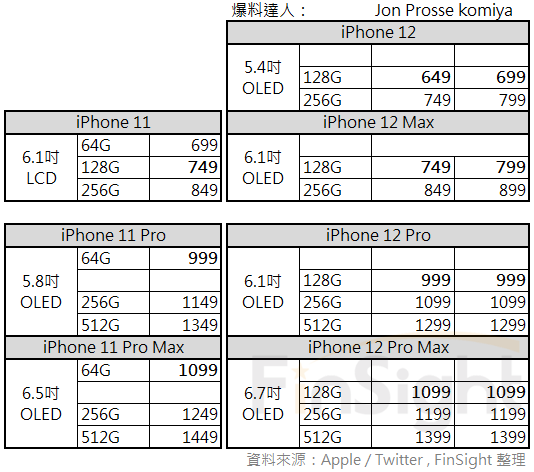
Honestly, we are looking forward to hardware vendors pushing value products to drive consumer electronics sales. Add the analysis of US tech earnings above, and the tech leaders remain our main buys.
Of course, if consumer electronics ends up different from our read, we also have to be mentally prepared for the electronics supply chain to start an inventory correction.