
Taiwan Q4 2021 filings: record profits, but inventory days rose 9.8 days year over year and electronic component makers added 13 days.
In March 2022 we wrote about inventory piling up at US retailers. The macro data at that point showed inventory building fast at every stage of the chain, in manufacturing and in retail alike. The corporate filings said the same thing: US inventory hit a record high in the fourth quarter of 2021, and inventory growth of 15% year over year had caught up with revenue growth. So the shortage is easing. As inventory piles up further downstream, the odds of another restock are dropping sharply, and if consumption comes in below expectations, destocking pressure will show up over the next few months.
Key takeaways
- Taiwan's fourth quarter 2021 filings show revenue and profit growth at record highs, but inventory days across all Taiwan-listed companies rose 9.8 days from a year earlier.
- Electronics is where the problem sits: free cash flow is falling fast on a surge in capital spending (capex), and the year over year rise in inventory days is the largest in our data. The first quarter 2022 filings released so far show electronics inventory getting worse, not better.
- Electronic components are the worst group: inventory days up 13 days year over year while profitability slipped. In every cycle in our data, a rise of more than 5 days has been followed by an inventory correction.
- The sell signal is close: the Taiwan purchasing managers index (PMI) spread of new orders minus customers' inventories hit a cycle low in March 2022, one step from turning negative.
When we wrote that piece, Taiwan's filing season was not finished, so we could not see how much inventory Taiwan companies had built in the fourth quarter of 2021. Now we can. Below we work through the Taiwan filing data and read it against the inventory cycle framework we use for Taiwan electronics.
Taiwan profitability is still excellent, but capex and inventory both jumped
We aggregate the financials of Taiwan-listed companies to get the ratio trends below. Revenue and profit growth in the fourth quarter of 2021 were still at record highs. At the same time, companies took an optimistic view of future demand, expanded capital spending and built inventory, and inventory days for the whole market rose 9.8 days from a year earlier.

Split the Taiwan market into electronics, financials and non-tech sectors and this is what shows up.
- Electronics free cash flow is shrinking fast, mostly because capital spending expanded so much. With free cash flow down, if operations do not improve further, the pace of capex expansion has to slow. And with rates rising, borrowing to fund that spending costs more than it used to.
- The more serious problem in electronics is the jump in the dollar value of inventory. The year over year rise in inventory days is the largest since our data begins. In the first quarter 2022 filings released so far, electronics inventory has not improved at all, it has risen further, and on the historical pattern that points to trouble ahead.
- Non-tech sectors look different. Free cash flow keeps setting records, so these companies have plenty of cash on hand to work with. Because their capex increase is nowhere near as large as in electronics, that cash flow should support higher dividends. Inventory value is also at a record here, just not to the degree electronics is.

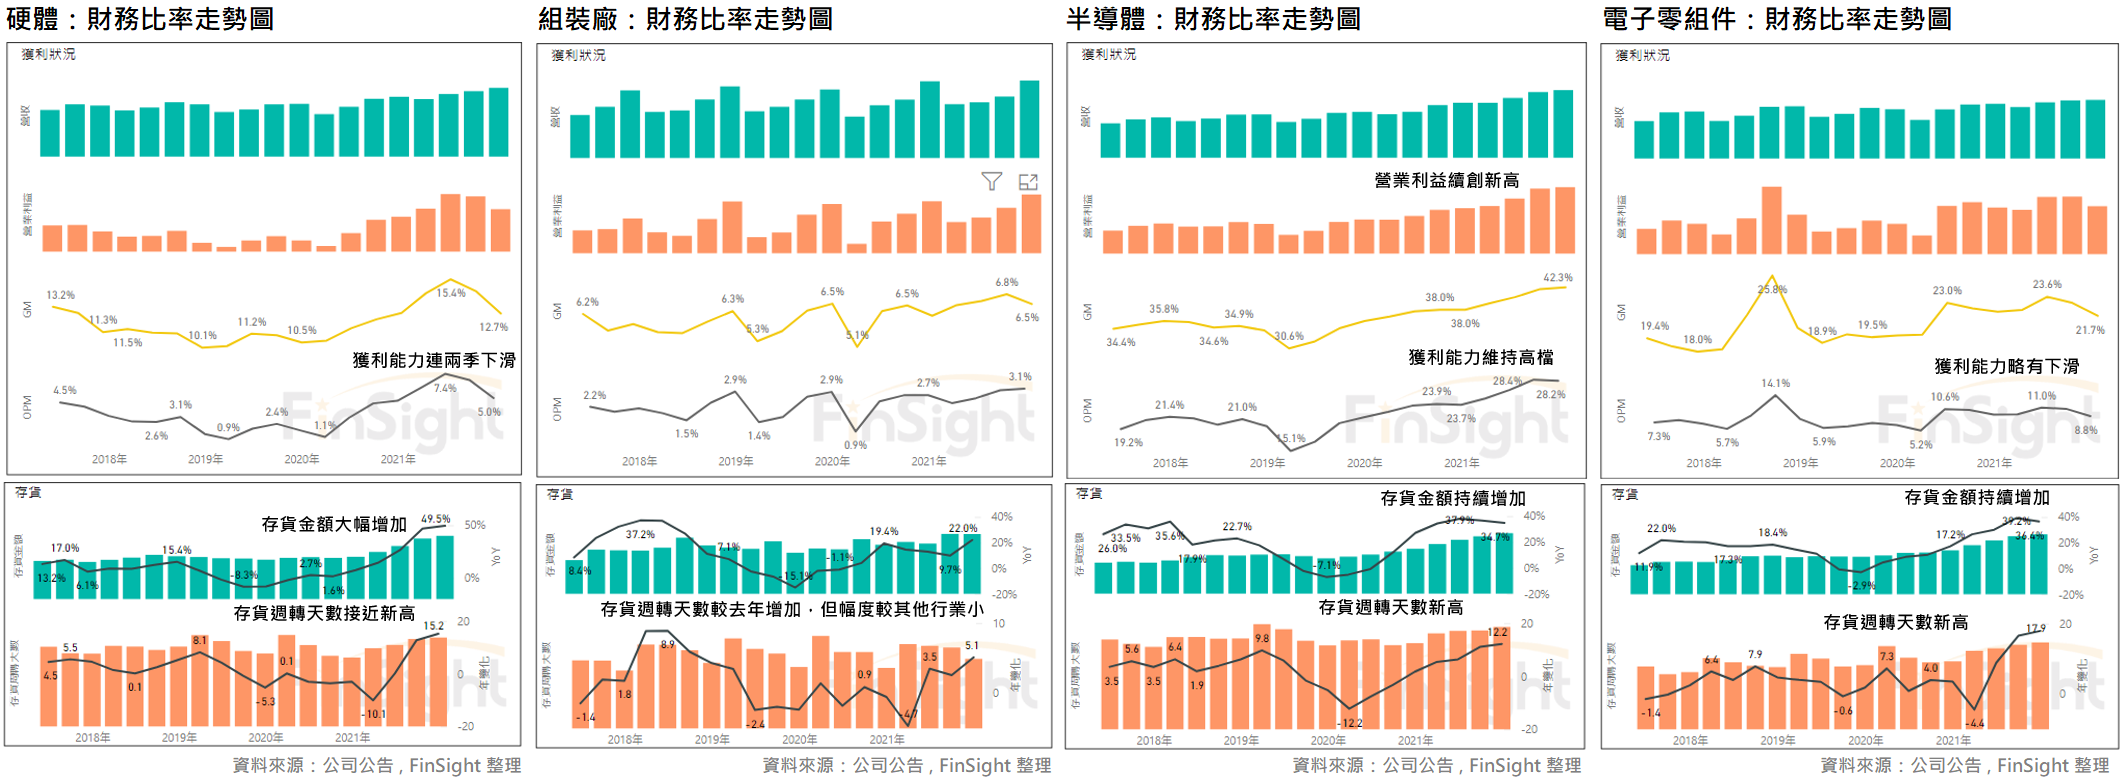
Break Taiwan electronics down further into four groups: hardware brands, contract assembly and manufacturing, semiconductors and electronic components.
- Hardware brands: profitability is falling while the dollar value of inventory is at a record high.
- Contract assembly and manufacturing: as shortages ease, inventory days have come down, but the dollar value of inventory is still at a record.
- Semiconductors: inventory value keeps setting records and inventory days are close to the 2019 high, but profitability is still the best of the four.
- Electronic components: we think this is where the inventory build is most visible. Inventory days rose 13 days from a year earlier while profitability slipped a little. If a destocking cycle starts, the pressure on component makers is likely to be the heaviest.
Measured against past cycles, this inventory build is fast. In every cycle in the Taiwan electronics inventory data we compile, once inventory days rise by more than 5, an inventory correction has followed. Our earlier work also found that the most important soft sell signal in this cycle is the Taiwan PMI spread of new orders minus customers' inventories. That reading hit a cycle low in March 2022, one step from turning negative and firing the sell signal. Figure 4 puts the electronics index next to the PMI spread, exports and inventory days.
Taiwan's manufacturing PMI is published monthly by CIER (the Chung-Hua Institution for Economic Research). Like ISM, its sub-indices are diffusion readings around 50, so new orders minus customers' inventories is a spread, not a level. The electronics index is the TWSE electronics sector index, the electronics subindex of the Taiwan Stock Exchange.

End demand for consumer electronics is weakening, and the downstream effects are what to watch
Aggregate inventory does not tell you anything about a single company. It does tell you about the chain: supply is easing and inventory is building fast, and in the past that has never been a good signal.
What worried us most was high inventory running into weakening end demand, because that is what opens a destocking cycle. The macro data is now clearly rolling over. PMI new orders have dropped hard across countries, and new orders in the US manufacturing PMI are at their lowest since the middle of 2020.

In consumer categories, end demand has already turned. Electronics sales within US retail sales are down 10% year over year. With demand that weak, consumer electronics makers will fire the first shot in working inventory back down.

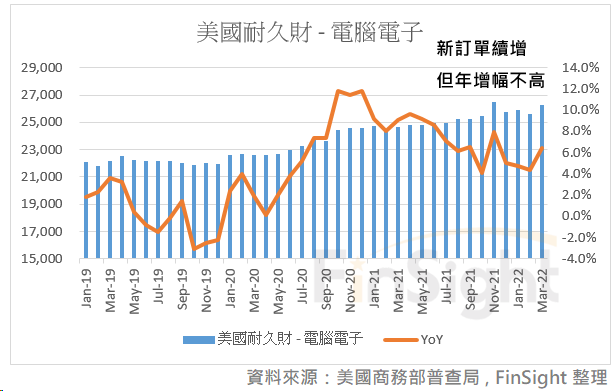
Enterprise cloud demand is still solid. Computers and electronic products within US durable goods were near a record high in the latest monthly data available in April 2022, though the year over year rate is not as high as it was in 2021. Watch this one anyway: when corporate profit estimates start coming down and cash on hand shrinks, capital spending follows. We would not expect to see that in the data for another two quarters, and nothing is visibly loosening yet.
Bottom line: record inventory into a consumer pullback means the correction starts here
Look at current corporate earnings estimates and there is still no meaningful cut. Plenty of stocks now trade on low price to earnings (P/E) multiples, and plenty of investors will look at that and see cheap.
We would be careful about earnings per share (EPS) estimates coming down, given the backdrop: the Fed is still tightening, the macro cycle is heading down, inventory levels are rising and corporate cash flow is falling. So far the market has repriced multiples, not earnings. Whether earnings get cut from here is what our own analyst estimate work is built to track, and across the first quarter 2022 filings released to date the downward revisions are still small.
If the fundamentals have not cracked yet, is a falling price telling you something you have missed? That depends on the research approach you start from and whether the trade behind it is long term or short term. Right now top-down work, which starts from the macro picture, sees risk everywhere, while bottom-up work, which starts from the individual company, sees opportunity everywhere. In our experience, when the two approaches disagree, it is hard to get a big move in either direction; the data eventually forces them to converge on one side.
So the question that matters is position sizing. What position size lets you sit through the swings comfortably and still leaves you able to add to good names that get thrown out at the lows? That is the question to ask yourself in a volatile market.