
A year after FinSight's last post, we mark every 2025 call to market and find AI adoption ran faster than we said.
FinSight's last post went out on July 10, 2025. Today is July 10, 2026. One year, to the day.
Key takeaways
- A year on, the 1Q26 numbers ran past us: Microsoft AI ARR of $37B, up 123%, and Google Cloud generative AI revenue up nearly 800%.
- The public clouds raised prices for the first time in two decades, and one-year H100 leases rose 38% between October 2025 and March 2026.
- We underestimated the speed. We overhauled our own LLM revenue table twice in two months, and our optimism was still conservative.
- Next up is compute supply and demand, where two independent frameworks, completion schedules and cost curves, point at the same window.
That post was titled "The AI Application Boom: Enterprise Adoption Is Accelerating Exponentially, and We Are at a Historic Turning Point Across the Cycle." Then we stopped publishing for a year. The research never stopped; it just stayed in our own notes. That post got stress-tested harder than anything else we have written. So the first post of our return offers no new view. It does something FinSight has done since the beginning: it keeps a scorecard.
We lay out the predictions we made in writing a year ago and mark them to market against today's data, item by item. Where we were right, we say where. Where we were wrong, we say where. Data, reasoning, then the call. Let's go.
Scorecard 1: "AI investment is not a bubble" (June 6, 2025)
The post: "Is AI Capital Spending Justified? An AI Investment Bubble? Let the Data Answer."
What we said then: Google I/O 2025 showed token volumes growing 50x in a year. AI would create more than $100B of value in 2025, more than the incremental capex of the hyperscalers over the same period. Far from overbuilding, AI investment might not even keep up with demand.
The data a year later: 1Q26 came in hotter than anything we were willing to put on paper.
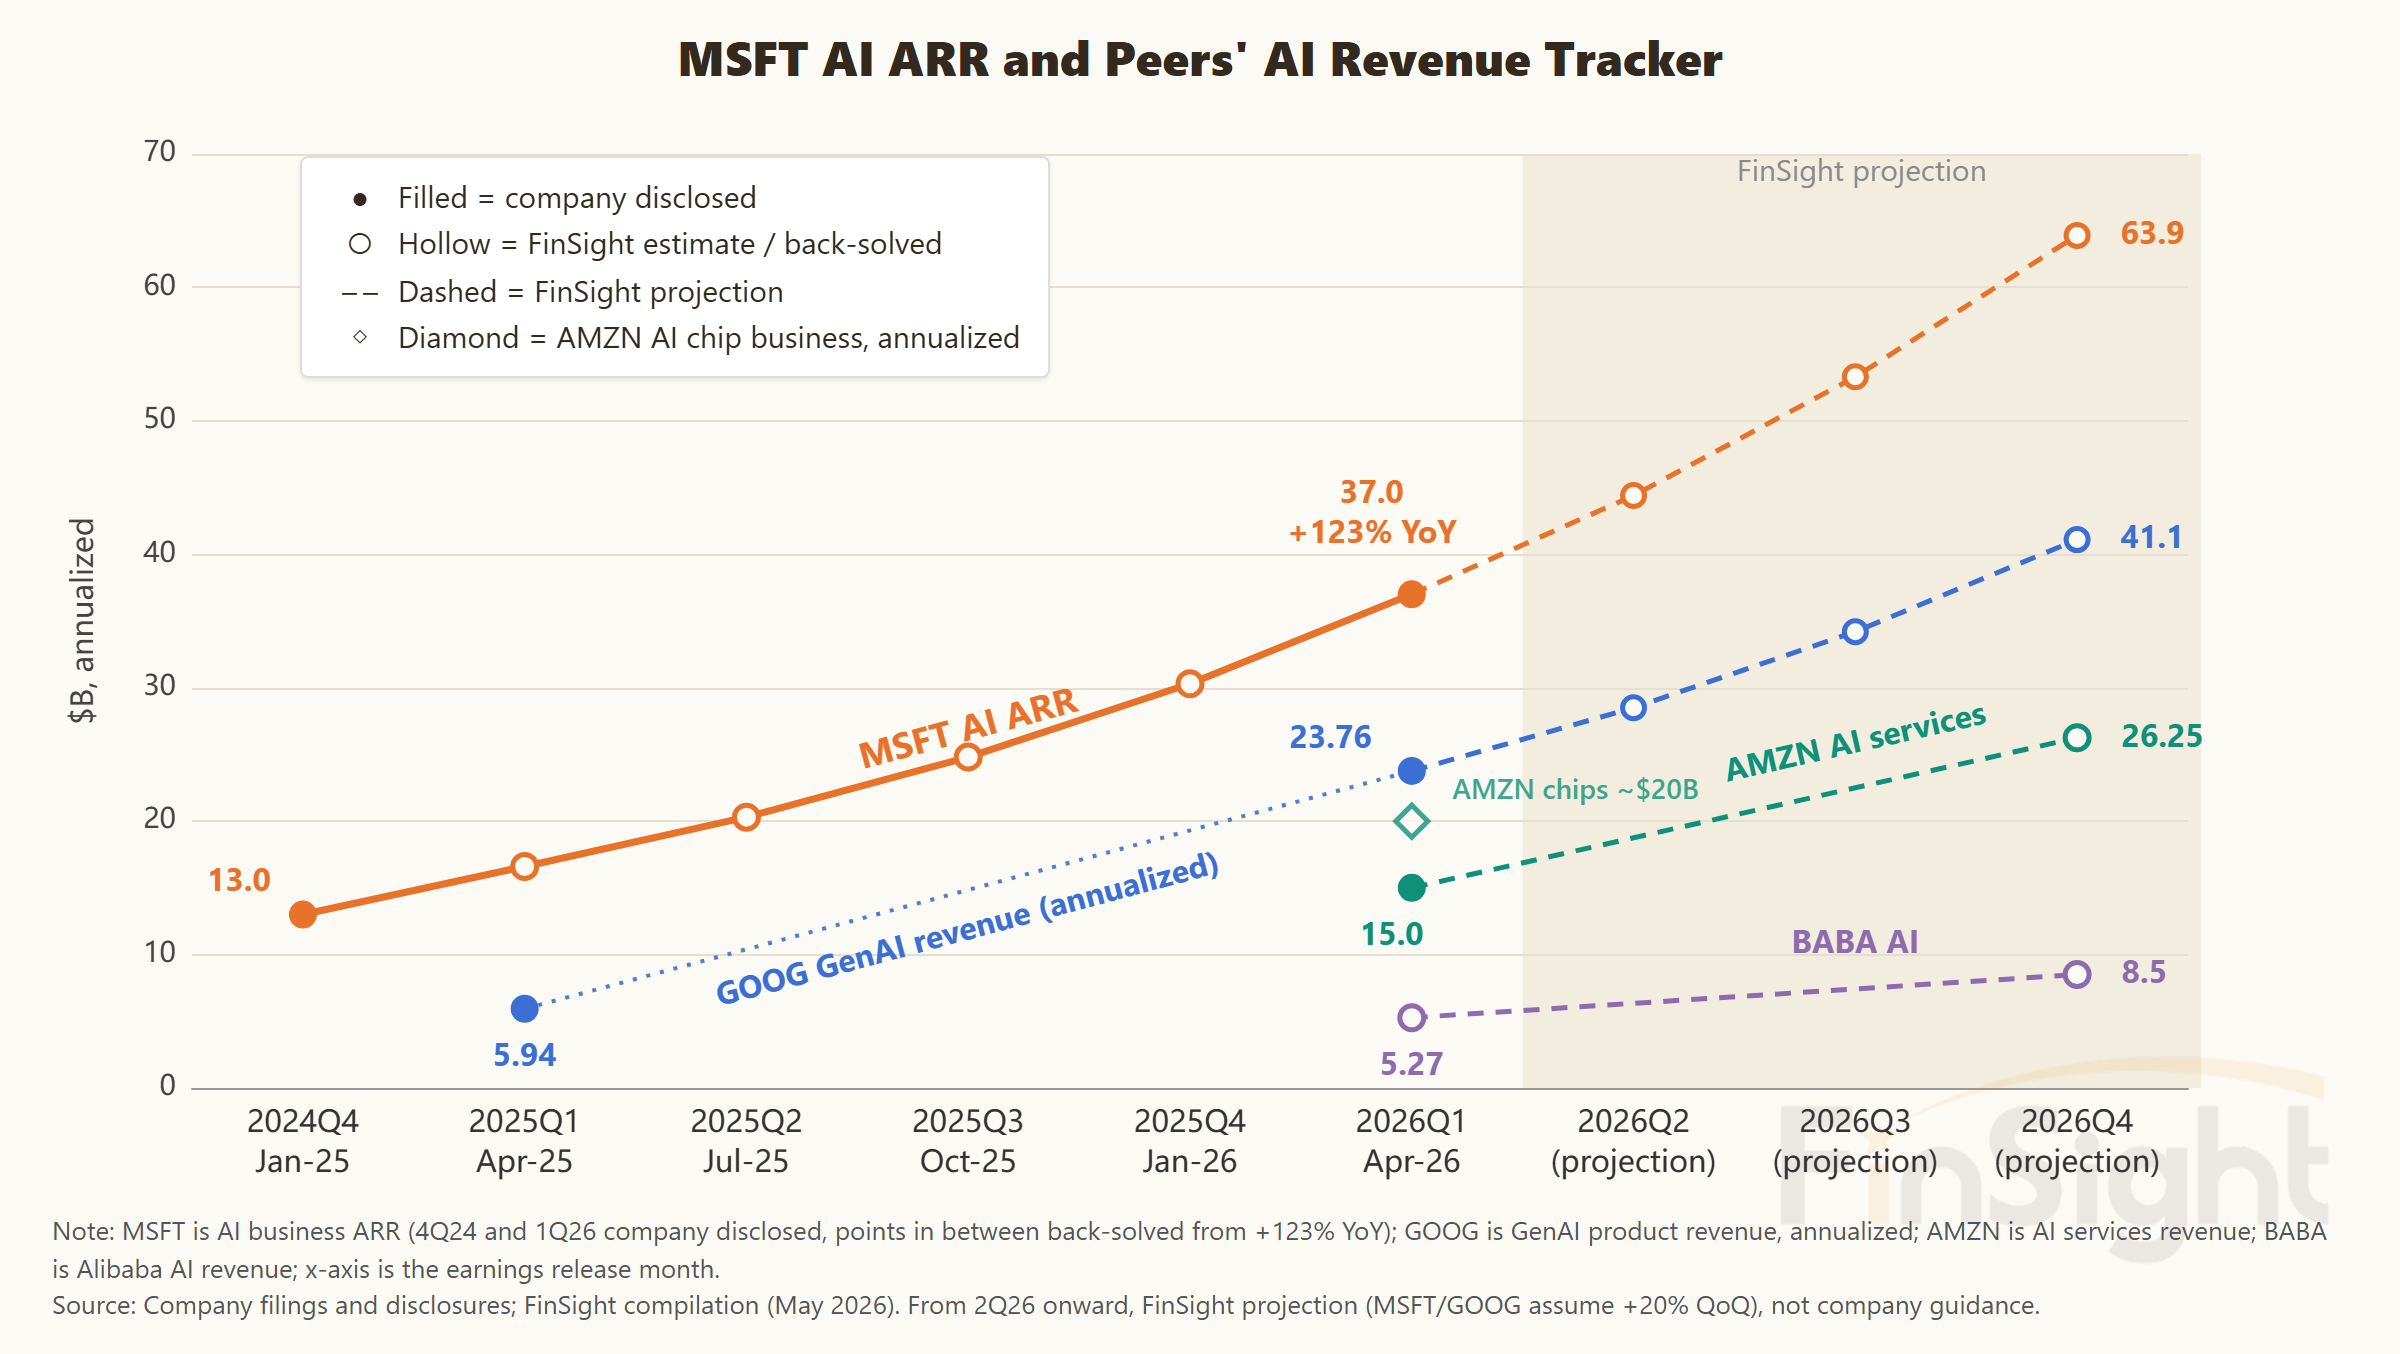
- Microsoft: AI business ARR of $37B, up 123% (it was only $12B a year earlier); paid M365 Copilot seats passed 20 million, up 250%.
- Google: Cloud quarterly revenue crossed $20B for the first time, up 63%; generative AI product revenue up nearly 800%; management said for the first time that enterprise AI is now the primary driver of Cloud growth; backlog reached $462B.
- Amazon: AWS up 28%, the fastest in nearly four years, achieved on a $150B annualized revenue base; backlog of $364B, before counting the new Anthropic agreement in the $100B range.
- And the final arbiter of supply and demand, price: H100 rental prices turned up in December 2025; AWS raised prices in January 2026 and Google Cloud signaled it would follow; the price of a one-year H100 lease rose 38% between October 2025 and March 2026. The public clouds raised prices for the first time in two decades. That is not the shape of a bubble. It is the shape of a shortage.
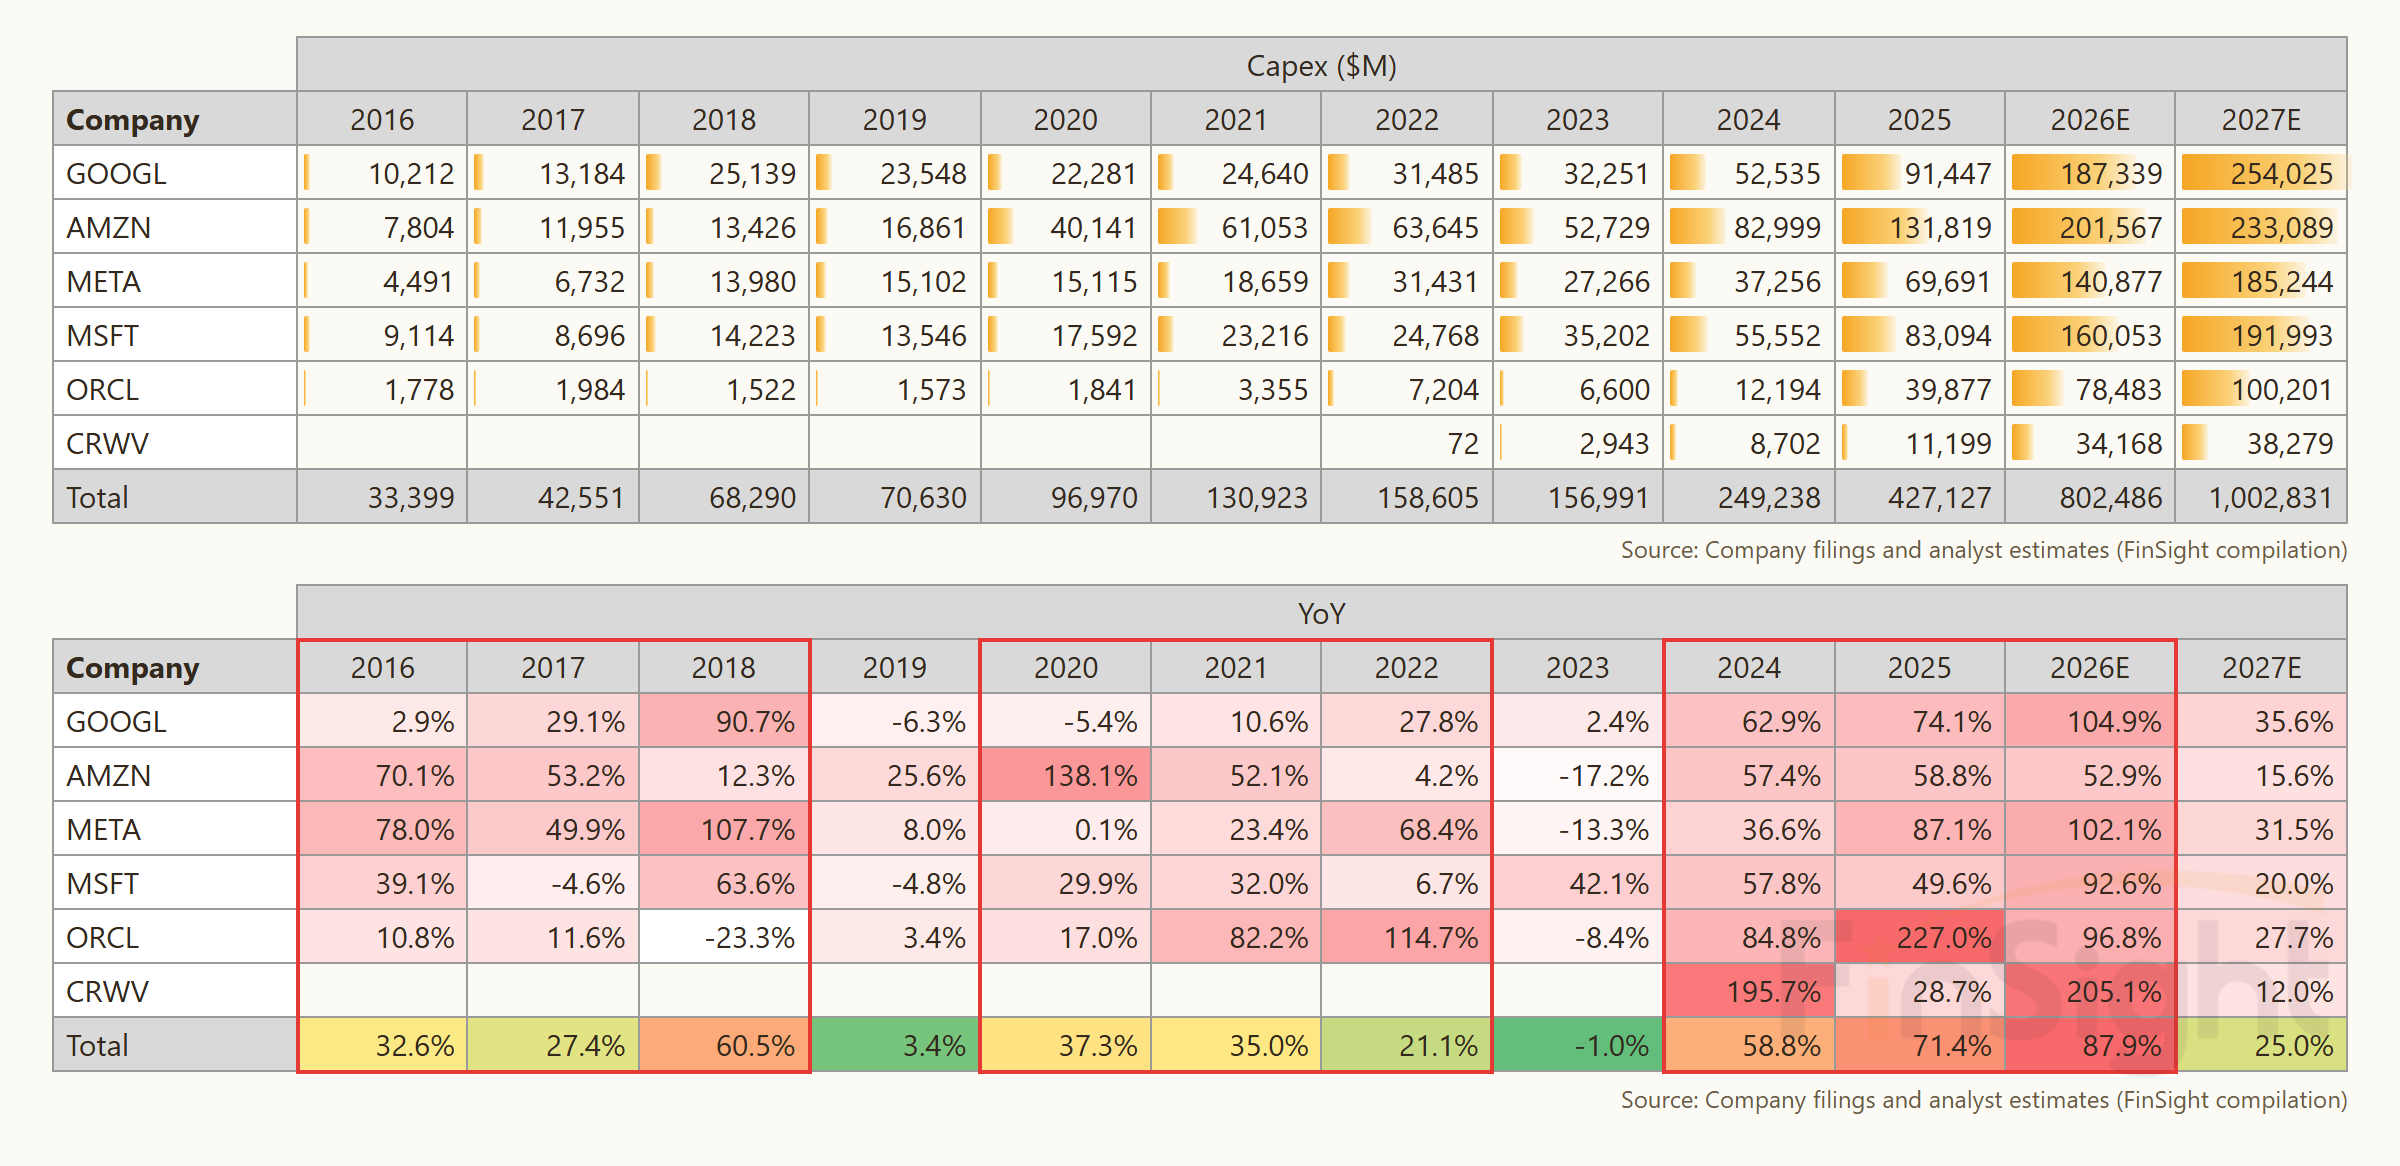
The dominant story in the market at the time was a "capex bubble." A year later, capex has not shrunk. Google raised its 2026 guidance to $180B to $190B and said plainly that 2027 would be "significantly higher." On the data so far, the pattern of demand running ahead and supply chasing has not changed.
Scorecard 2: "Enterprise adoption is accelerating exponentially" (July 10, 2025)
The post: "The AI Application Boom: Enterprise Adoption Is Accelerating Exponentially, and We Are at a Historic Turning Point Across the Cycle."
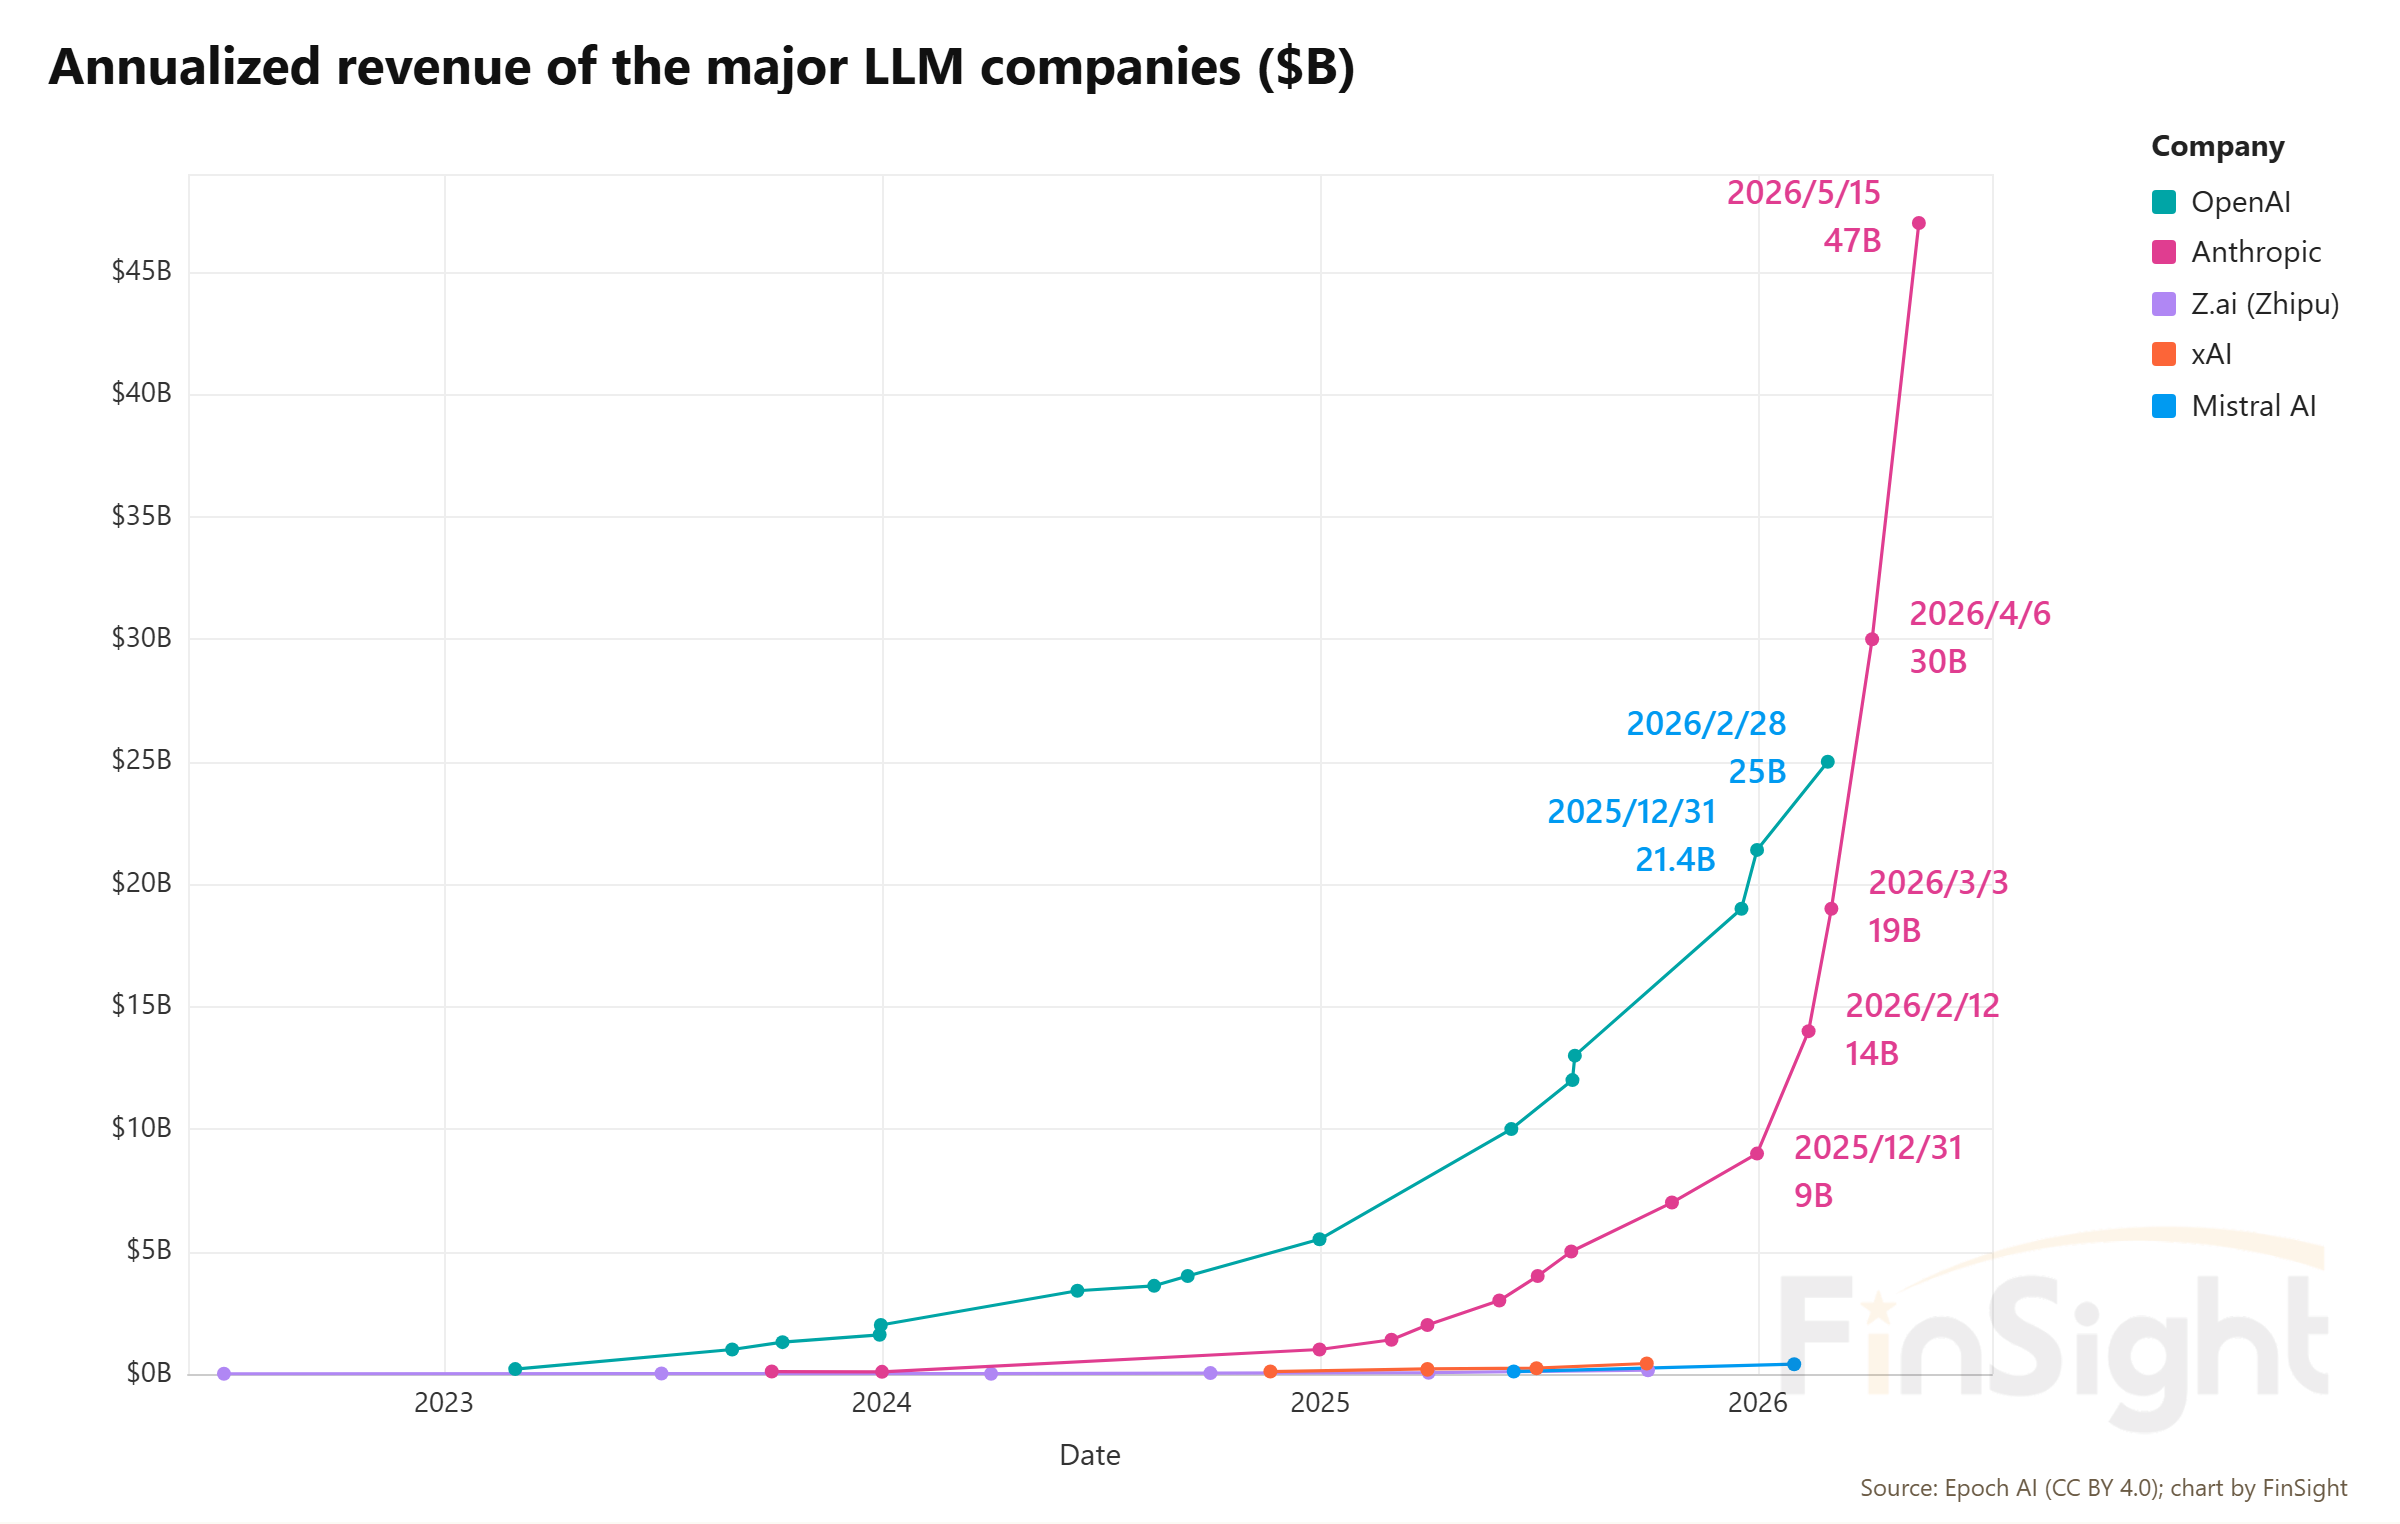
What we said then: Anthropic's ARR had jumped from $1B to $4B in half a year, enterprise paid AI adoption had risen from 8% to 42%, enterprise penetration was going exponential, and the big would get bigger.
The data a year later: the exponential curve did not bend. It got steeper.
The structure matters even more. More than 80% of Anthropic's revenue comes from enterprise customers. The number of customers spending more than $1M a year went from 500 in February 2026 to over 1,000 in April: doubling in two months. The company guided to its first quarterly operating profit in 2Q26. The consensus timeline had "the leading LLM company reaches $100B ARR" penciled in for the end of 2027; at May's $47B and the current slope, that milestone has a real chance of arriving more than a year early.
Our judgment then was that the key to growth was enterprise, not consumer. The real moats are enterprise integration, the API ecosystem, and coding assistants: the places switching costs are highest. OpenAI conceded the point in March 2026, when it pivoted publicly to enterprise.
Scorecard 3: "The final sell signal in the electronics inventory cycle" (May 13, 2025)
The post: "The Complete Guide to the Electronics Inventory Cycle, Part 4: Taiwan's Final Sell Signal Has Fired."
What we said then: Taiwan's PMI new orders minus customer inventories had turned negative, the final sell signal of the electronics inventory cycle. Historically a market low follows within one to five months, but with AI and non-AI diverging, this correction might be milder than history, and long-term investors could treat it as a chance to add quality names.
The data a year later: the correction was indeed far milder than history, and if you split AI from non-AI, the inventory buy signal appeared right after the mid-August 2025 earnings releases (inventory days fell year over year, and both inventory dollars and their growth rate fell). What followed: after the SOX broke out in late August, EPS estimates were revised higher by 24% in short order; in September a monthly momentum signal we track on the SOX flipped to overbought, which in past cycles has marked the start of the bull leg; 3Q25 Taiwan electronics results showed the sector still early in an up-cycle. Historically these EPS upgrade cycles tend to run a year to a year and a half. But cycles come with no guarantees.
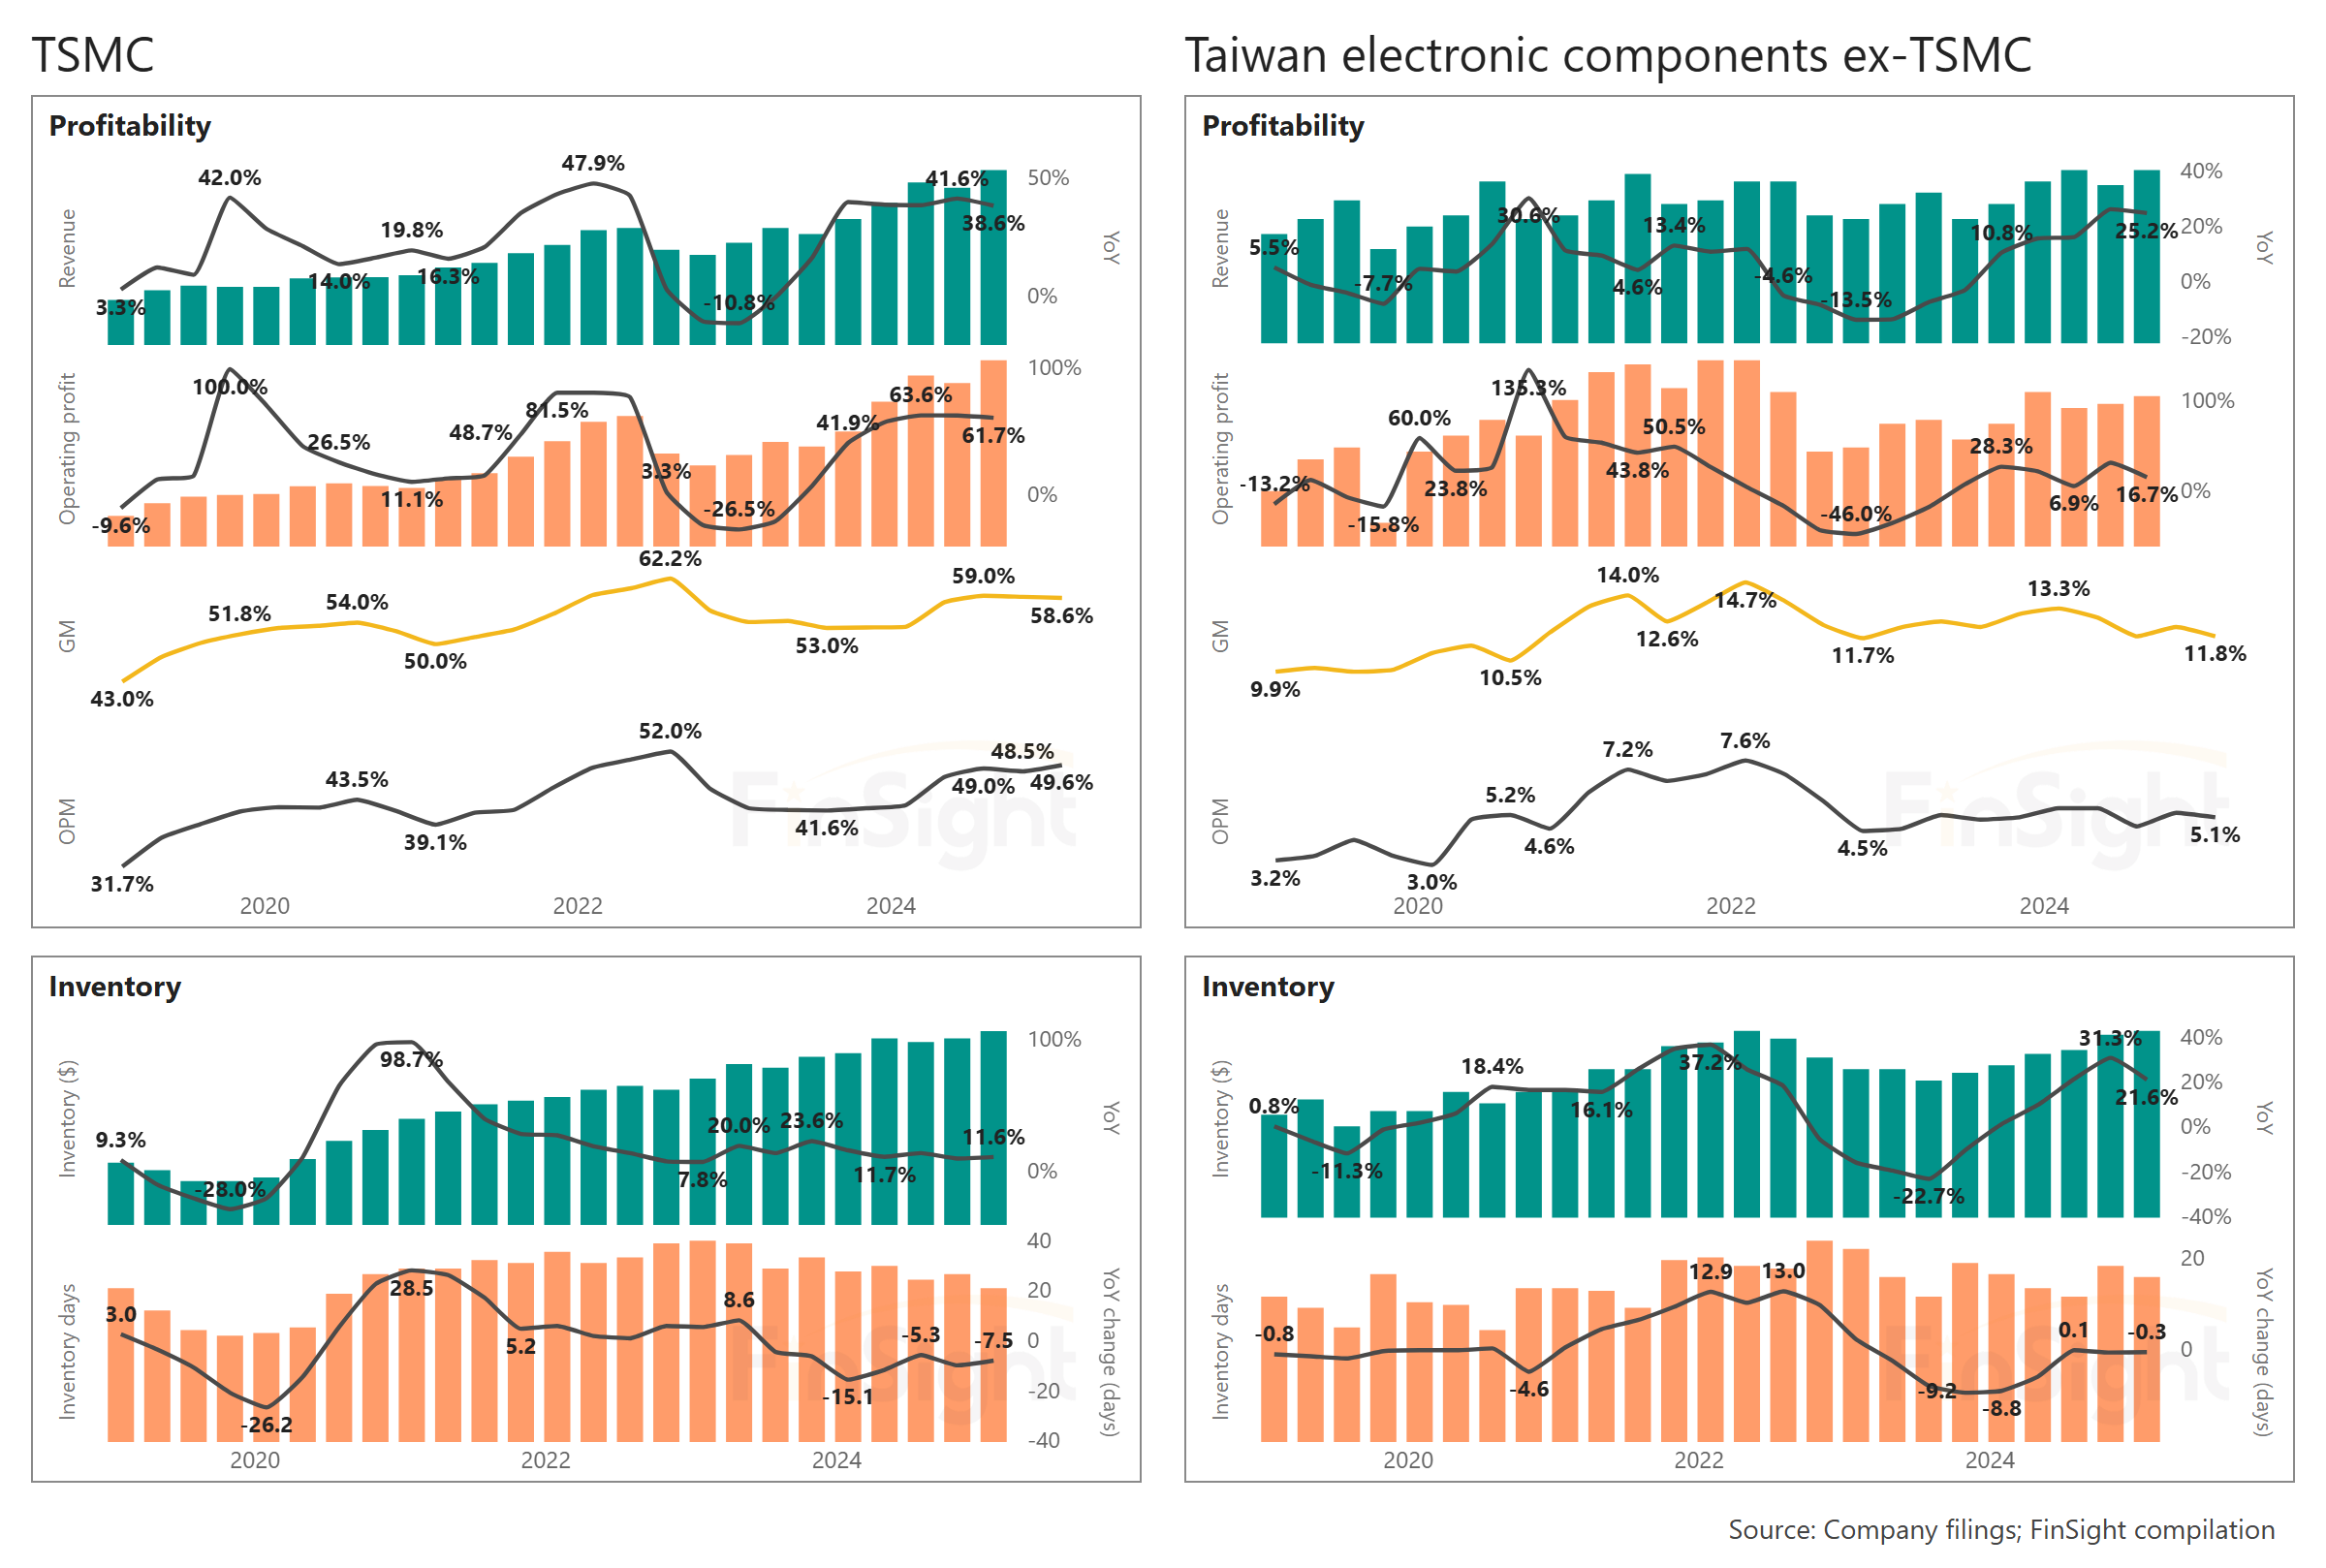
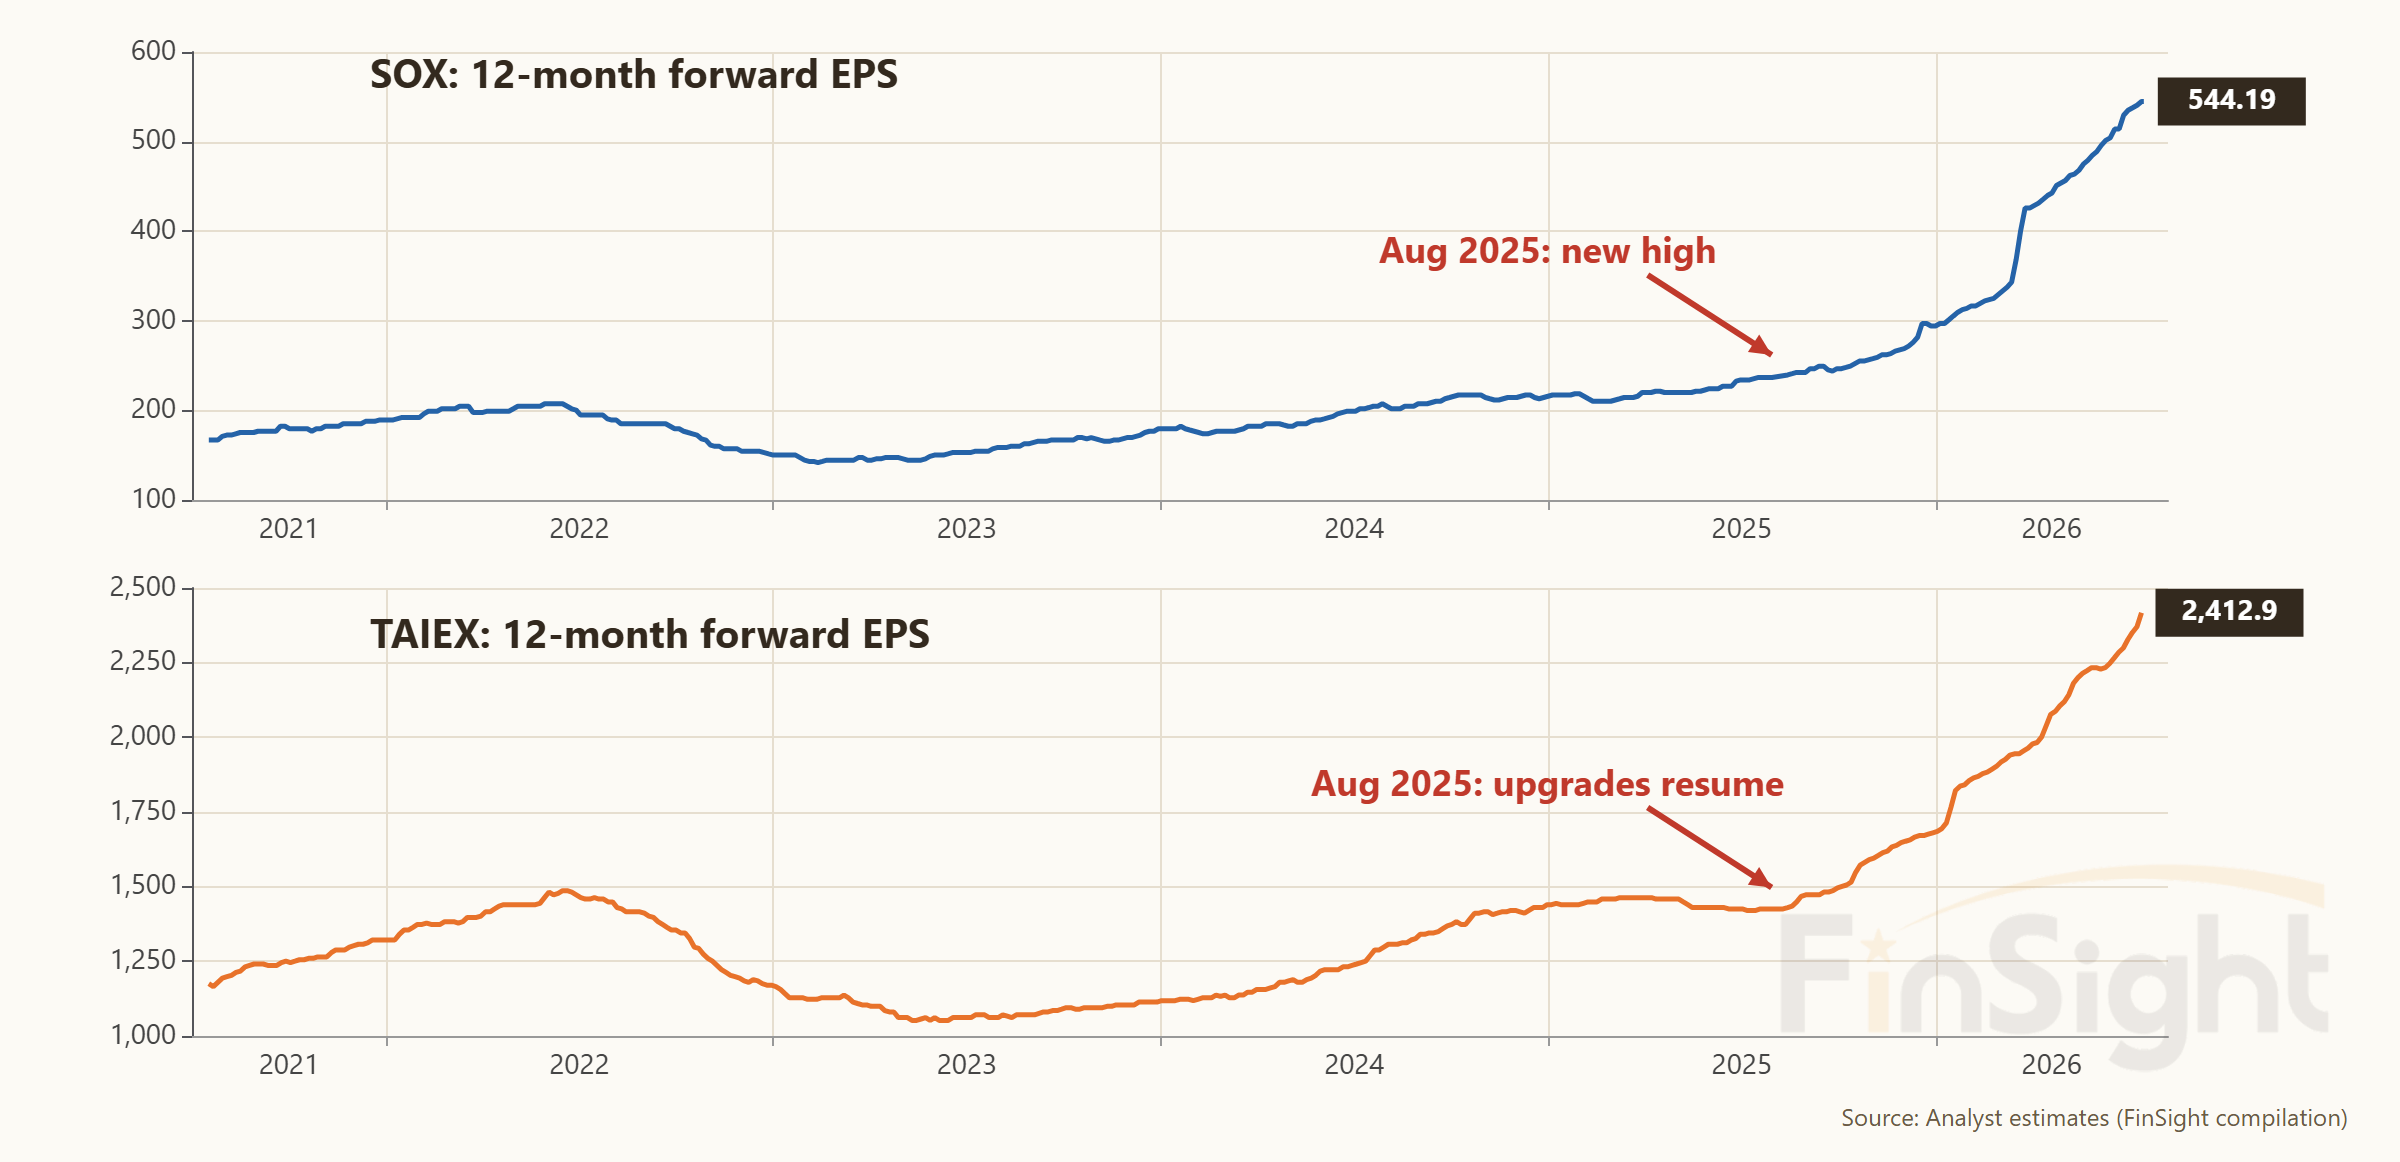
Reading "cycle" and "trend" separately is the framework we kept stressing in the inventory cycle series, and splitting the two still works in this AI-driven round.
What we got wrong or underestimated
We underestimated the speed. We were among the most optimistic voices in the market on AI demand, and the actual numbers still ran past every upward revision we made. In the first two months of 2026 we overhauled our own LLM revenue estimate table twice. If the $100B ARR milestone arrives a year early, our "optimism" was actually conservative.
We underestimated the market impact of OpenAI's turbulence. We worried early about the contradiction of OpenAI signing enormous compute contracts on a consumer-led path, and that call was directionally right. But the size and spread of the valuation reset triggered by the 4Q25 circular deals narrative went beyond what we expected. Getting the fundamentals right does not mean the volatility will spare you.
One item that was open then and is close to settled now: since May 2026 the Token Price Expenditure Index published by Silicon Data, a GPU-market data provider, has come down, and the market briefly read it as an early sign of weakening demand. During the break we worked most of this through. The price of tokens at equivalent capability has fallen roughly 50x a year for three years running; a falling price index is the normal result of price cuts and mix shift, not a retreat. At the same time, prices on the input side rose across the board: one-year H100 leases up 38% in five months, on-demand compute booked out to August and September 2026. Output prices falling while input prices rise: if demand were really weakening, rents and spot component prices would fall first, not token list prices. We have moved from leaning toward mix shift to being fairly confident in it. More on this soon.
Next: compute supply and demand
The scorecard is settled. A year of research is stacked up. It ships as posts, back to back.
The next post takes up compute supply and demand. During the break we used Epoch AI's public data to do two things: we ran "how long will compute stay short" through data center completion schedules, site by site, and we ran "when does AI capex cross the payback line" through a cost-curve method. Two independent frameworks point to the same window. That is the most important research result of our year, and it answers a question the market argued about for six months (GPU depreciation lives, whether compute is overbuilt) with very few actual numbers on offer.
Counter-signals: what would change our mind
Credibility after a return comes from checking the scorecard in public, so we write down in advance the signals that would make us change our view:
- Demand: token volume growth stalls and cannot be explained by price cuts or mix shift; GPU rental prices soften before supply arrives in volume; LLM ARR upgrades stop. These are the core premises of the AI bull case, and a turn in any one of them would send us back to re-evaluate.
- Capex: hyperscaler guidance shifts from "raising" to "flat or lower"; public cloud profitability stops improving. If the hypothesis that "they make more money even while investing enormous sums" is overturned, our five-year cycle thesis (the framework that treats this AI build-out as one multi-year up-cycle) has to be rewritten.
- The cycle: Taiwan PMI new orders minus customer inventories turns negative again; electronics inventory days deteriorate. Our signature buy and sell signal framework keeps running as usual, with trend and cycle read separately.
Every quarter we mark the actual numbers against these predictions and update the scorecard. When the signals change, we change with them.
Editor's note: on pressing the publish button
To close, a personal note from the editor, written in the first person: a lighter account of where this year got stuck, and how things will run from here.
Many readers wrote to ask when the next post was coming. The research never stopped. What stopped was the step of turning research into articles. Turning an internal note into something publishable means removing the shorthand only I understand, adding context, redrawing the charts, writing a headline, checking every number. Each piece is several hours at minimum, and the research always ran ahead of the writing. Run long enough, and a year goes by.
The turning point was a little funny. Last month, when Anthropic released its latest model, Fable 5, I had it read every FinSight article from the past five years, plus the research notes from this past year. Its diagnosis was one sentence:
"You are not short of content or quality. All you are missing is pressing the publish button."
Getting read that accurately by a machine is a very 2026 experience.
So FinSight will run a new way from here. And AI is not only handling the step from notes to articles; the research itself is now done with AI. The most important piece of this year, the compute supply and demand work, was done with AI from cleaning public data through modeling, cross-checking and producing the charts. What used to be about a month of work now takes a few days. The research direction and the views are still mine, and when I am wrong it is still on me, but the whole workflow has been redesigned. The style may differ slightly from before, but this is the most efficient way to get the research out.
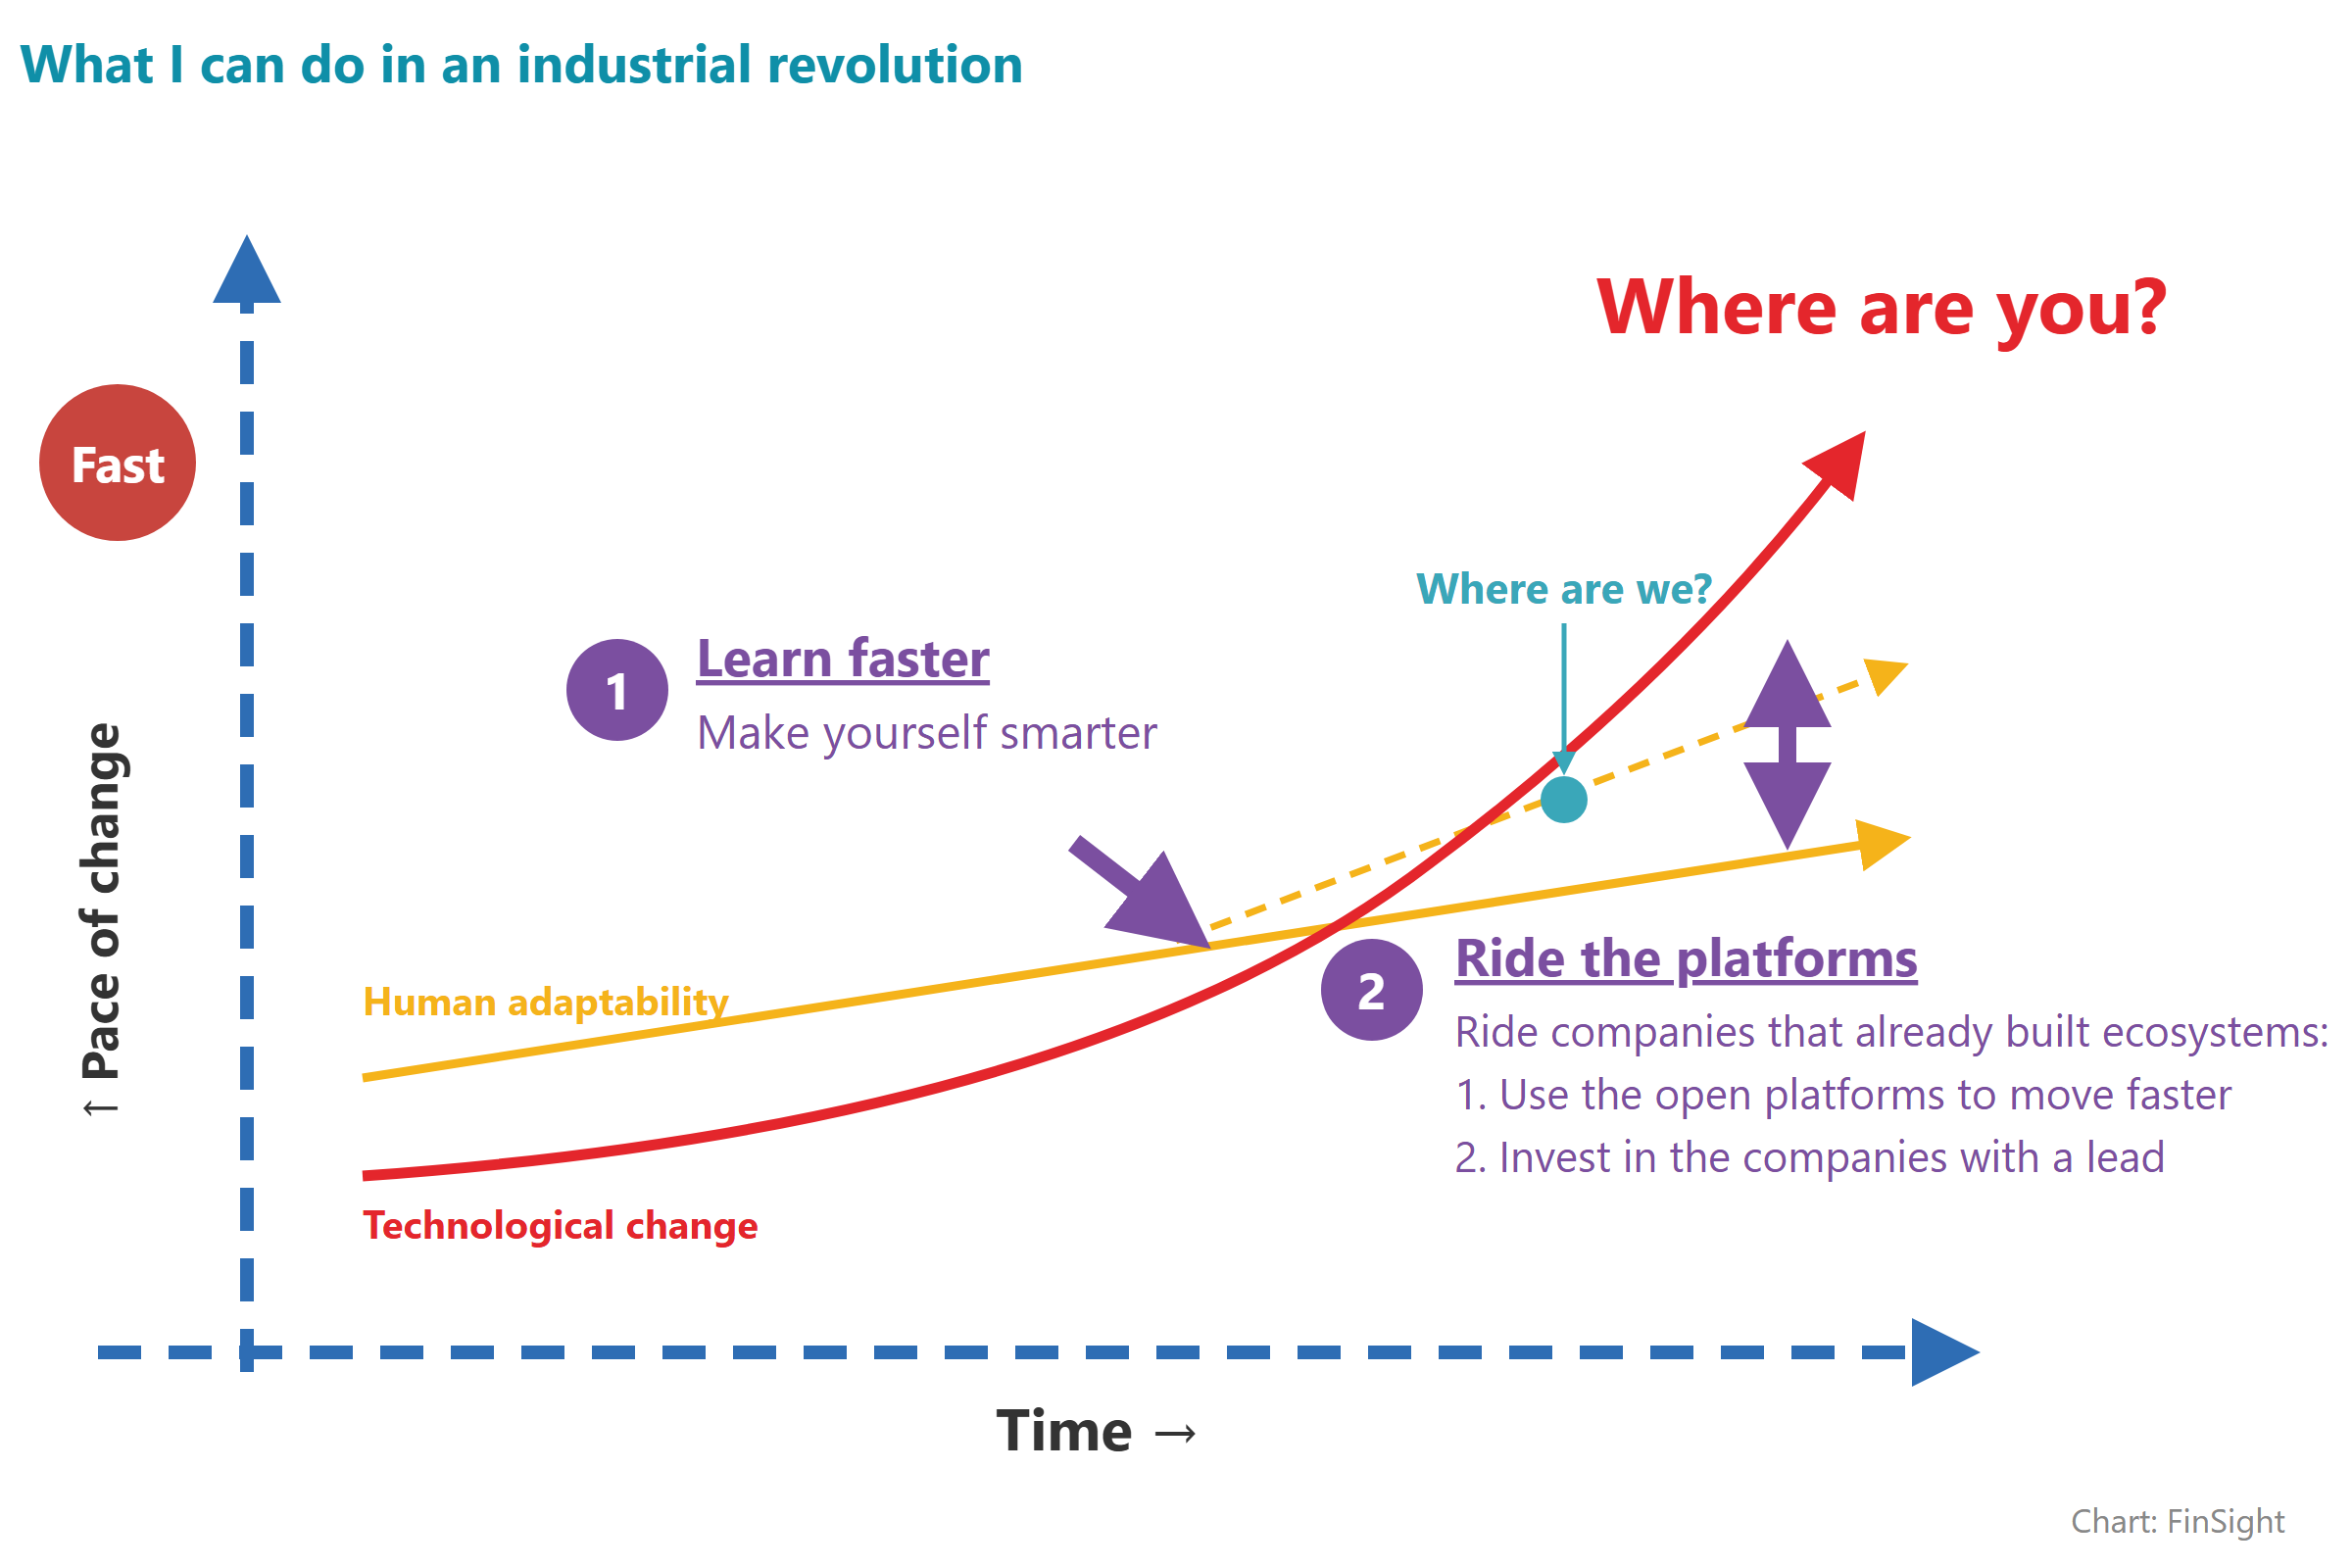
None of this is a new idea. At the end of 2021, in "Technology Is Changing the World: How Should We Face an Industrial Revolution?", I wrote that in a changing environment there were two things I could do: learn faster, so I keep up with the data era; and lean on the companies that have already built ecosystems, using the open platforms and new ways of working to raise my own value, while investing in the companies with a lead. Back then the platform was data tooling, and FinSight's data work was my first attempt. Four and a half years later the platform is AI, and this return is the second run of the same framework. That has always been at the core of how I approach the AI era: a blog about how AI is changing white-collar work had better be first to change its own workflow.
July also happens to be when, two years ago, I wrote about the things I learned from my mentor. Of the three lessons, the first was to keep learning and the third was that setbacks are worth something. A year off the air was a setback. This scorecard is the learning.
I am back.