
Taiwan's electronics inventory sell signal fired on May 2, 2022. Ten years of data say the index low prints before the buy signal, after drops of 20% plus.
This post started as a narrow question: what does the TWSE electronics sector index (the electronics index, the core of the Taiwan market) do between the moment the inventory sell signal fires and the moment the buy signal fires? We ended our May 2022 post, the one calling the inventory correction coming to Taiwan's electronics supply chain, by saying that if you follow the electronics inventory signals, the low in the index lands inside that window: after the sell signal, before the buy signal.
Key takeaways
- The current sell signal fired on May 2, 2022. Inventory value and inventory days are both still making new highs, so base effects alone put the earliest possible buy signal in the second quarter of 2023.
- Two of the past three sell signals were followed by a fall of more than 20% in the electronics index, 25% in 2015 and 20% in 2018.
- Every buy signal since 2013 opened the most efficient stretch to be long, up 29%, 22% and 74% to the next sell signal.
- The index low lands between the two signals, so the signals will not get you there, and volatility stays high until the buy signal fires.
A tool that works over a long stretch is only useful if you spell out the trading logic behind it. Otherwise the research and the execution drift apart. So this post starts from the electronics inventory buy and sell signals and works through the choices a trend follower would make. Other trading styles get their own post later.
The inventory signals will not get you the low
We defined the buy and sell signals on the Taiwan electronics inventory cycle in earlier work.
- Sell signal: Taiwan PMI new orders minus inventories turns negative (the preliminary sell signal), or new orders minus customers' inventories turns negative (the final sell signal), and exports turn negative year over year.
- Buy signal: inventory days in the electronics chain fall below their year-earlier level.
Taiwan's manufacturing PMI is published monthly by CIER, the Chung-Hua Institution for Economic Research. Like ISM, its sub-indices are diffusion readings around 50, so new orders minus inventories is a spread between two diffusion readings, not a level. Inventory days come from the reported financials of Taiwan-listed electronic component makers, which is why a buy signal is confirmed only once a quarter's filings are complete.
The current sell signal fired on May 2, 2022. With inventory value and inventory days both still making new highs, the earliest a buy signal can appear is the second quarter of 2023, purely on base effects. Whether it actually shows up then depends on how consumer demand behaves once the economy moves into recession in 2023.
After a sell signal and the drop that follows, the market starts hunting hard for an entry. History says a low has a good chance of printing before the strongest companies cut guidance, or once the economy is already in recession. The bottom is usually in well before the inventory buy signal fires.
Here is what the electronics index did around each buy and sell signal over the past ten years.
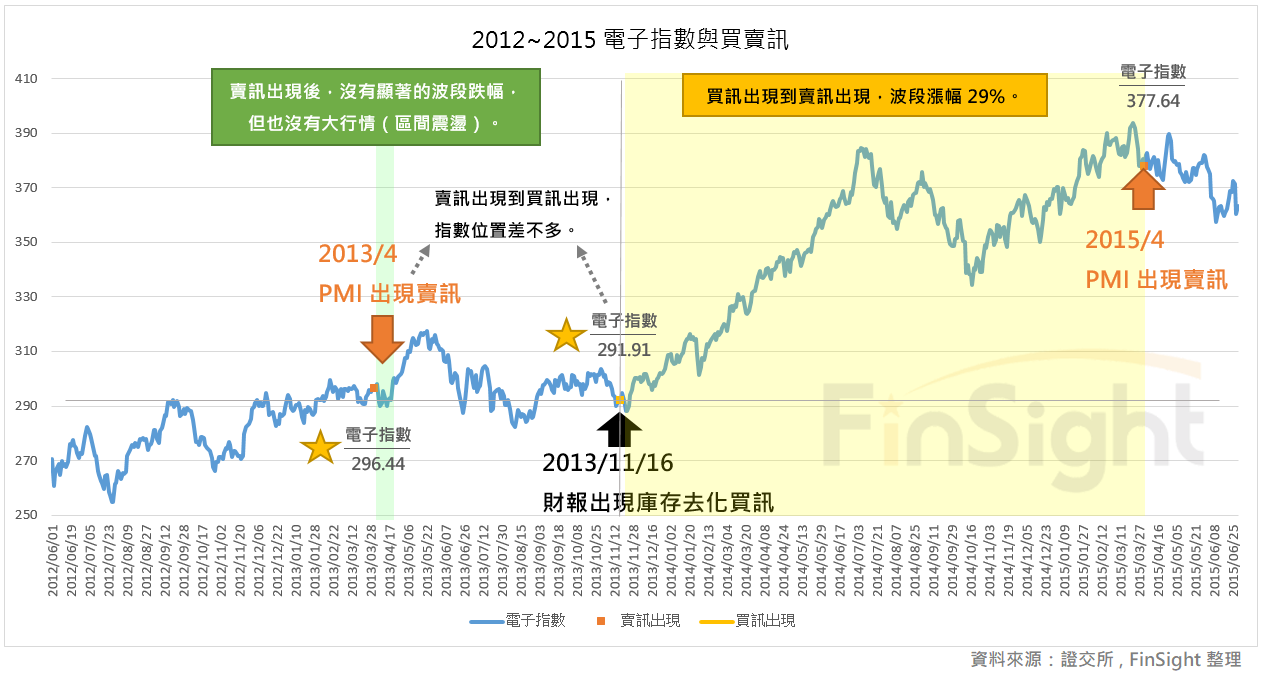
2012 to 2015
- Sell signal: the PMI sell signal came in April 2013. There was no large decline afterward, but there was no rally either.
- Buy signal: the second quarter of 2013 reading produced a buy signal executed on November 16, 2013. A bull leg followed, a steady grind higher rather than a spike, and the index gained 29% from there to the next sell signal. That was the best stretch of the cycle to be long.
2015 to 2018
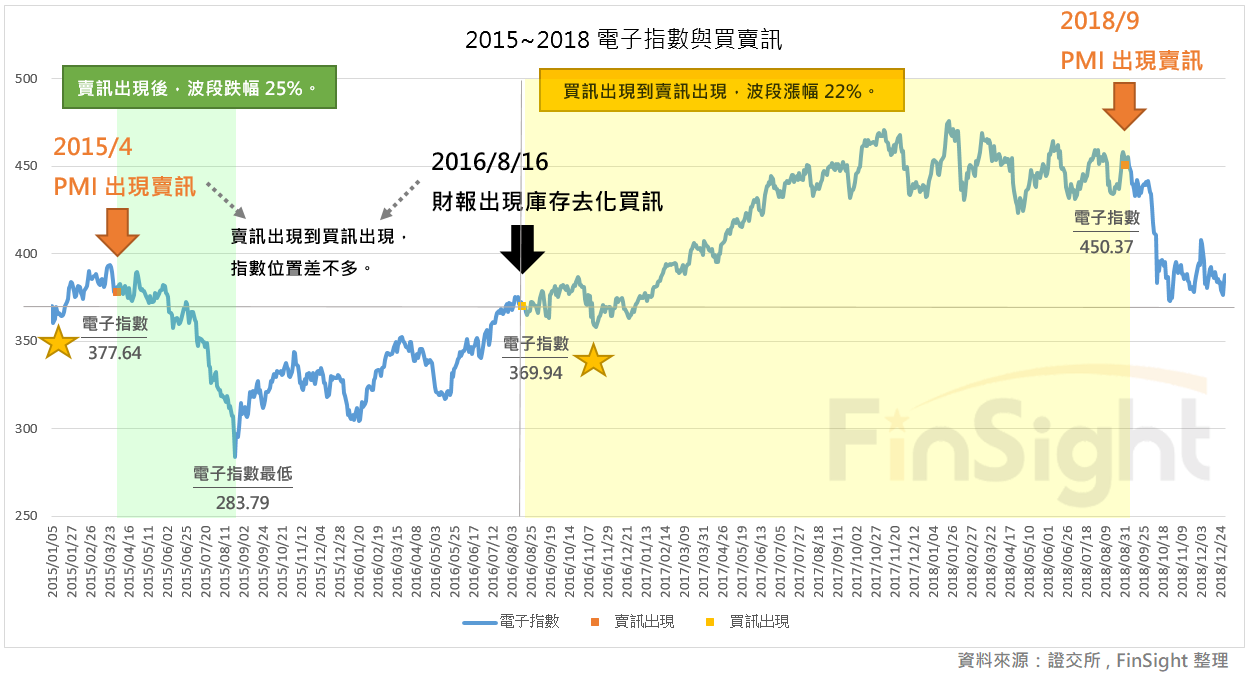
- Sell signal: the PMI sell signal came in April 2015. A month later the electronics index dropped hard, 25% from high to low, then recovered before the buy signal arrived. Price action was volatile the whole way.
- Buy signal: the second quarter of 2016 reading produced a buy signal executed on August 16, 2016. Volatility fell, the index consolidated for three months, and a bull leg then ran to the next sell signal for a 22% gain. Again, that is where the trend paid the most.
2018 to 2022
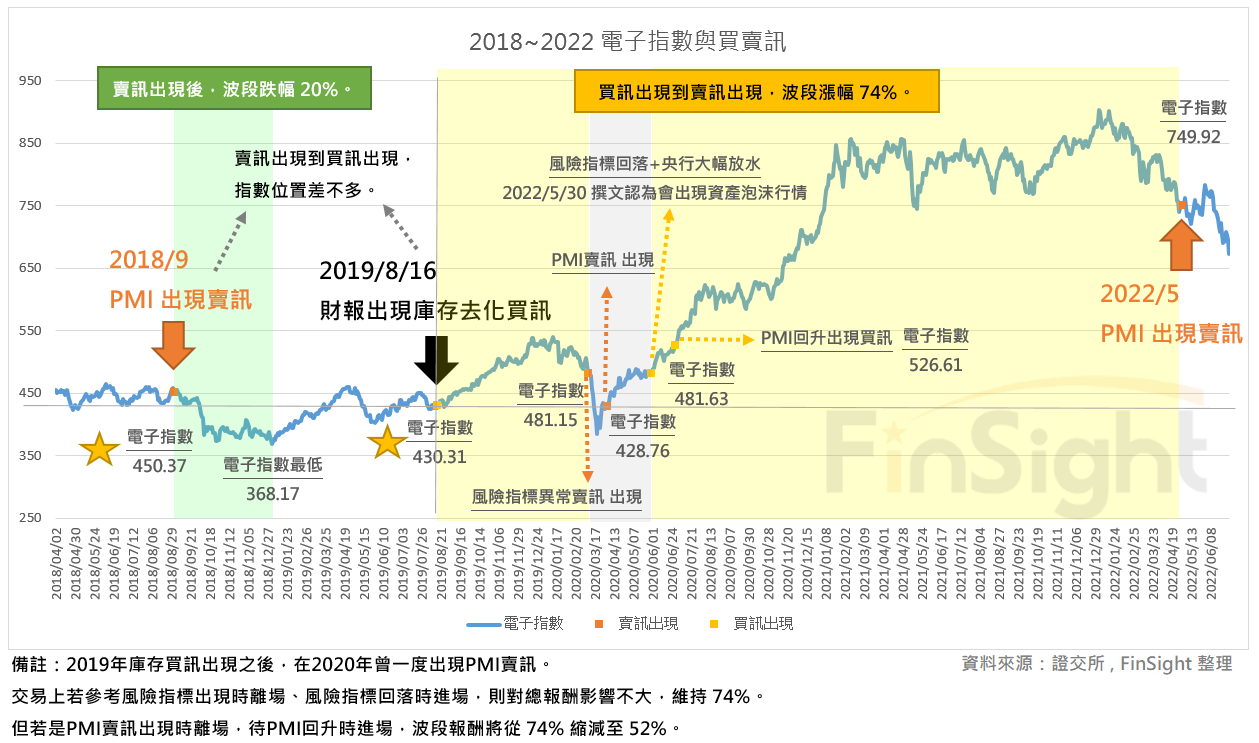
- Sell signal: the PMI sell signal came in September 2018. A month later the electronics index fell quickly, 20% from high to low, then recovered before the buy signal, helped by Fed rate cuts in 2019. Price action was volatile throughout.
- Buy signal: the second quarter of 2019 reading produced a buy signal executed on August 16, 2019, and the most efficient long stretch started immediately. The pandemic hit in the middle of it and still did not break the bullish trend that low inventory had set up. Ignoring the one-off pandemic sell signal in 2020, the gain was 74%. Exiting on that 2020 PMI sell signal and re-entering when the PMI recovered cuts it to 52%, which is still the most striking bull leg of the past ten years.
We were already publishing by 2020, and several of the marked dates line up with posts we wrote at the time.
- Selling when our risk dashboard (VIX, the dollar, Treasury yields and funding spreads) hit the danger zone and buying back when it came down: you end up at the same 74%, so the dashboard cost you nothing and took out the drawdown. The dashboard flashed an unusual sell signal on March 9, 2020, when we had only just started. We have written a lot about those indicators in the years since, so readers can monitor the risk data themselves for abnormal readings. On May 30, 2020, with the Fed flooding the system and the dashboard back down, we published our view that a large bull market and a possible asset bubble were coming, and we were especially positive on the tech names benefiting from the pandemic, where earnings and the multiple could expand at the same time.
- Selling on the PMI sell signal, new orders minus inventories below zero, and buying back when it turned positive: the gain falls from 74% to 52%. Slightly less, but still enough to ride an inventory cycle that ran further than anyone expected. The PMI sell signal came in April 2020, and selling there would have been close to the low for the year. New orders minus inventories turned positive in July 2020, which is where the long position goes back on. On June 8, 2020, we had already published a piece stressing how low industry inventory was and calling the return to the bull cycle playbook.
2022 to now
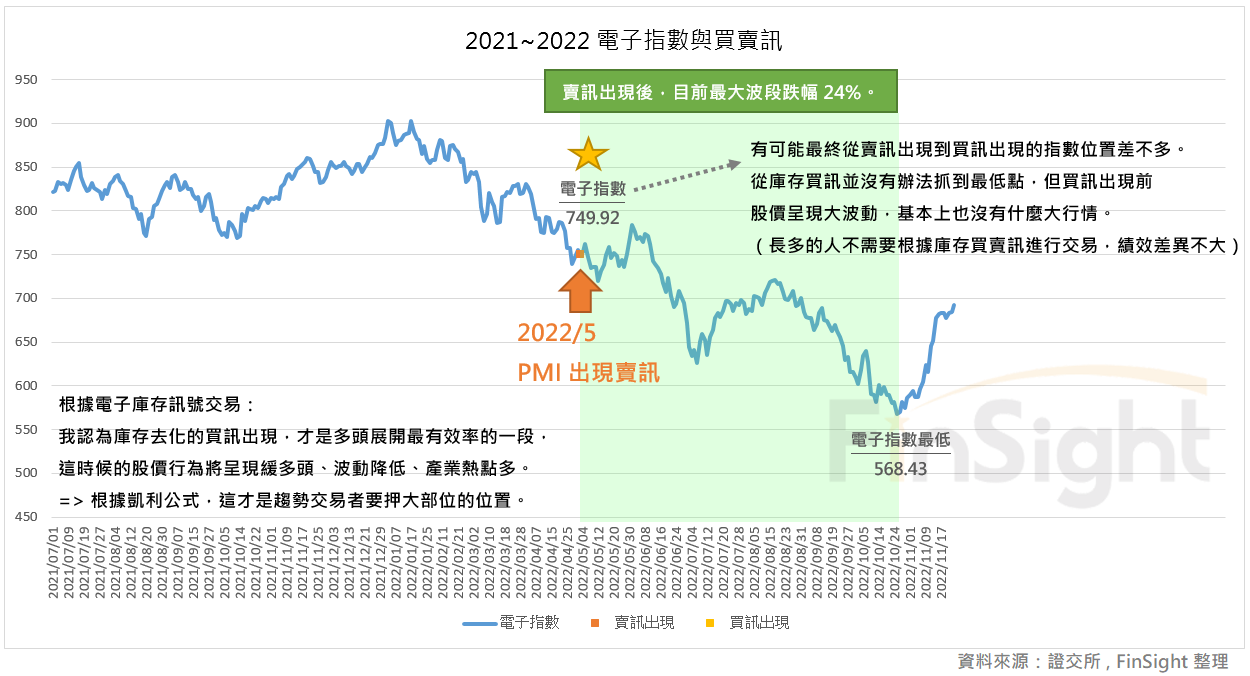
- Sell signal: the PMI sell signal came on May 2, 2022, and the electronics index fell hard a month later.
- Buy signal: on base effects, one could appear in the second quarter of 2023, executed on August 16, 2023. By then the economy will formally be in recession, and the path of consumer spending is still an open question. So while we can picture the buy signal scenario, in practice we take the signal as it comes rather than deciding the answer in advance.
Looking back at how prices behaved around each of these signals, a few things stand out.
- Get out of the way when the sell signal fires. The electronics index has a high probability of falling more than 20% afterward.
- Get in when the buy signal fires. A bull leg follows and it is the most efficient stretch to be long: price action shifts from wide swings to a steady grind higher, which raises the odds on carrying a larger position.
- The low usually prints after the sell signal and before the buy signal, so the inventory signals cannot be used to call it. What you can count on is that until the buy signal fires, volatility stays high.
- The index is often at a similar level at the sell signal and at the buy signal that follows, so for a long-term holder the round trip is close to a wash. This is a traders' tool.
Know what the signal can and cannot do, then fit it to your own trading logic
How you use a tool or an indicator comes down to your own trading logic. Once you know what it can and cannot do, you can pick the parts that fit the way you trade. Here is how our own trading logic applies to the electronics inventory signals.
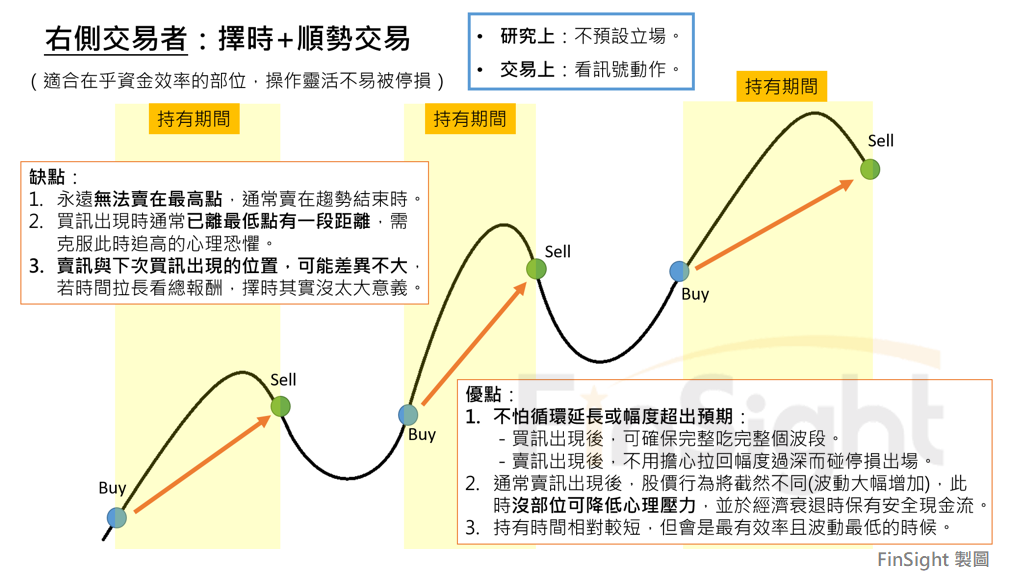
Take trend following, which in Taiwan is called right-side trading: you buy the trend once the turn is confirmed, while a left-side trader buys the turn itself. Once the electronics inventory sell signal fires, we stop holding a net long position, because the bad news nobody can see yet will come out one piece at a time. At that point the top-down trend is usually a more efficient guide than listening to companies explain their own results, and analyst earnings estimates still have room to be revised lower.
Once the buy signal fires, we hold at least a 50% net long position. Companies may still have no visibility, but if inventory is confirmed to be clearing, the whole environment gets healthier and the destocking pressure is gone. That is when we listen to more earnings calls and hunt bottom-up for the industry bright spots in the new bull cycle. Coming off the bottom, the companies that benefit first tend to see the trend before anyone else, so what those managements say is the highest-value information in the market at that point.
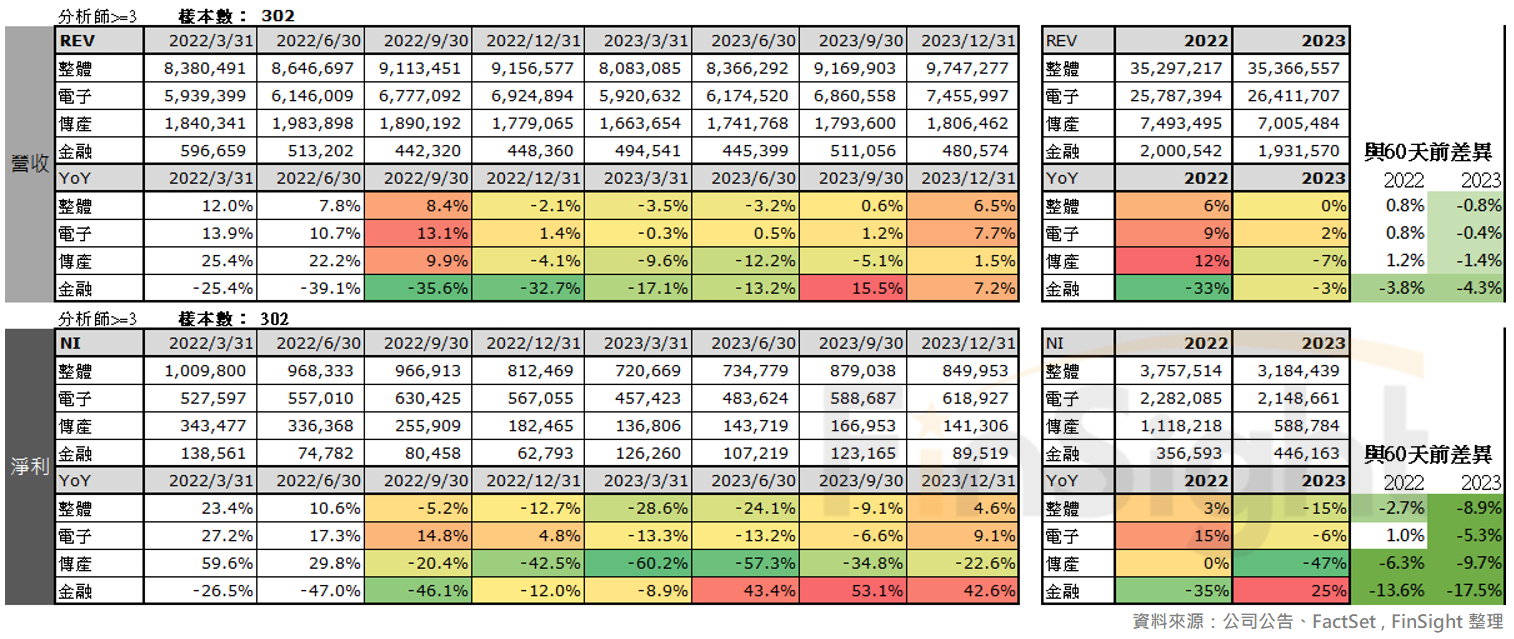
Right now the market expects Taiwan corporate earnings to bottom in the first half of 2023 and rebound in the second half. That is what the market thinks today, and it is already in today's prices. If demand comes in below expectations, whether earnings really recover that fast in the second half of 2023 stays an open question.
As a trend follower, we again prefer not to decide the answer in advance. Since the pandemic, every cycle has been larger and faster than the one before, and much of what is happening now has not happened in decades. However hard you study history, you have to be honest that there is a great deal about the future you do not know.
As an example, there are three ways the market is reasoning about 2023 that we do not buy.
- Using the last few recessions to infer this one. This one is not the textbook version.
- Using 30 years of Fed hiking and cutting statistics to read the current setup. There has been no high CPI in those 30 years, and today's inflation carries structural problems, including a mismatch in the labor market and the higher costs that come with producing locally. Both feed into central bank decisions.
- Reading a one-party, state-directed economy with capital markets instincts. From the war in Ukraine to China's reopening, market instincts have not read those decisions well.
On the future, we prefer to stay agnostic. When have we ever seen chip makers still raising prices while the industry destocks? When have we seen macro data rolling over across the board while consumption and employment held up at high levels? When have we seen governments put economic growth this far down the list, with the US and Europe controlling inflation and China controlling society?
Even so, the same thing happened at the start of 2022. Among all the uncertainties, we were sure that the Fed starting to drain liquidity would push stock P/E multiples into a derating cycle. Looking into 2023, the one thing we think we can be confident about is that a recession is coming. How that feeds into the market is a discussion for another day.
One last point: none of the signals we set for turning bullish has appeared.
- A turn in the Fed's stance. P/E multiples usually start recovering after the final hike, and the market's earliest estimate for that is somewhere between the first and second quarters of 2023.
- Inventory days in electronics falling year over year. One precondition for the industry improving is that inventory clears, and whether makers discount aggressively or hold down the absolute dollar level of inventory, both push inventory days lower. Earliest estimate is the second quarter of 2023.
- Risk indicators back in the normal range. VIX, the dollar and Treasury yields have all come off in the short term, but the liquidity risk measures are still at abnormal levels. History says the longer that persists, the more likely you get a liquidity event that is hard to handle.
Charlie Munger put it this way: "We try more to profit from always remembering the obvious than from working out the complicated."
Our advice to trend followers is to stay patient and wait for the turn signal.