
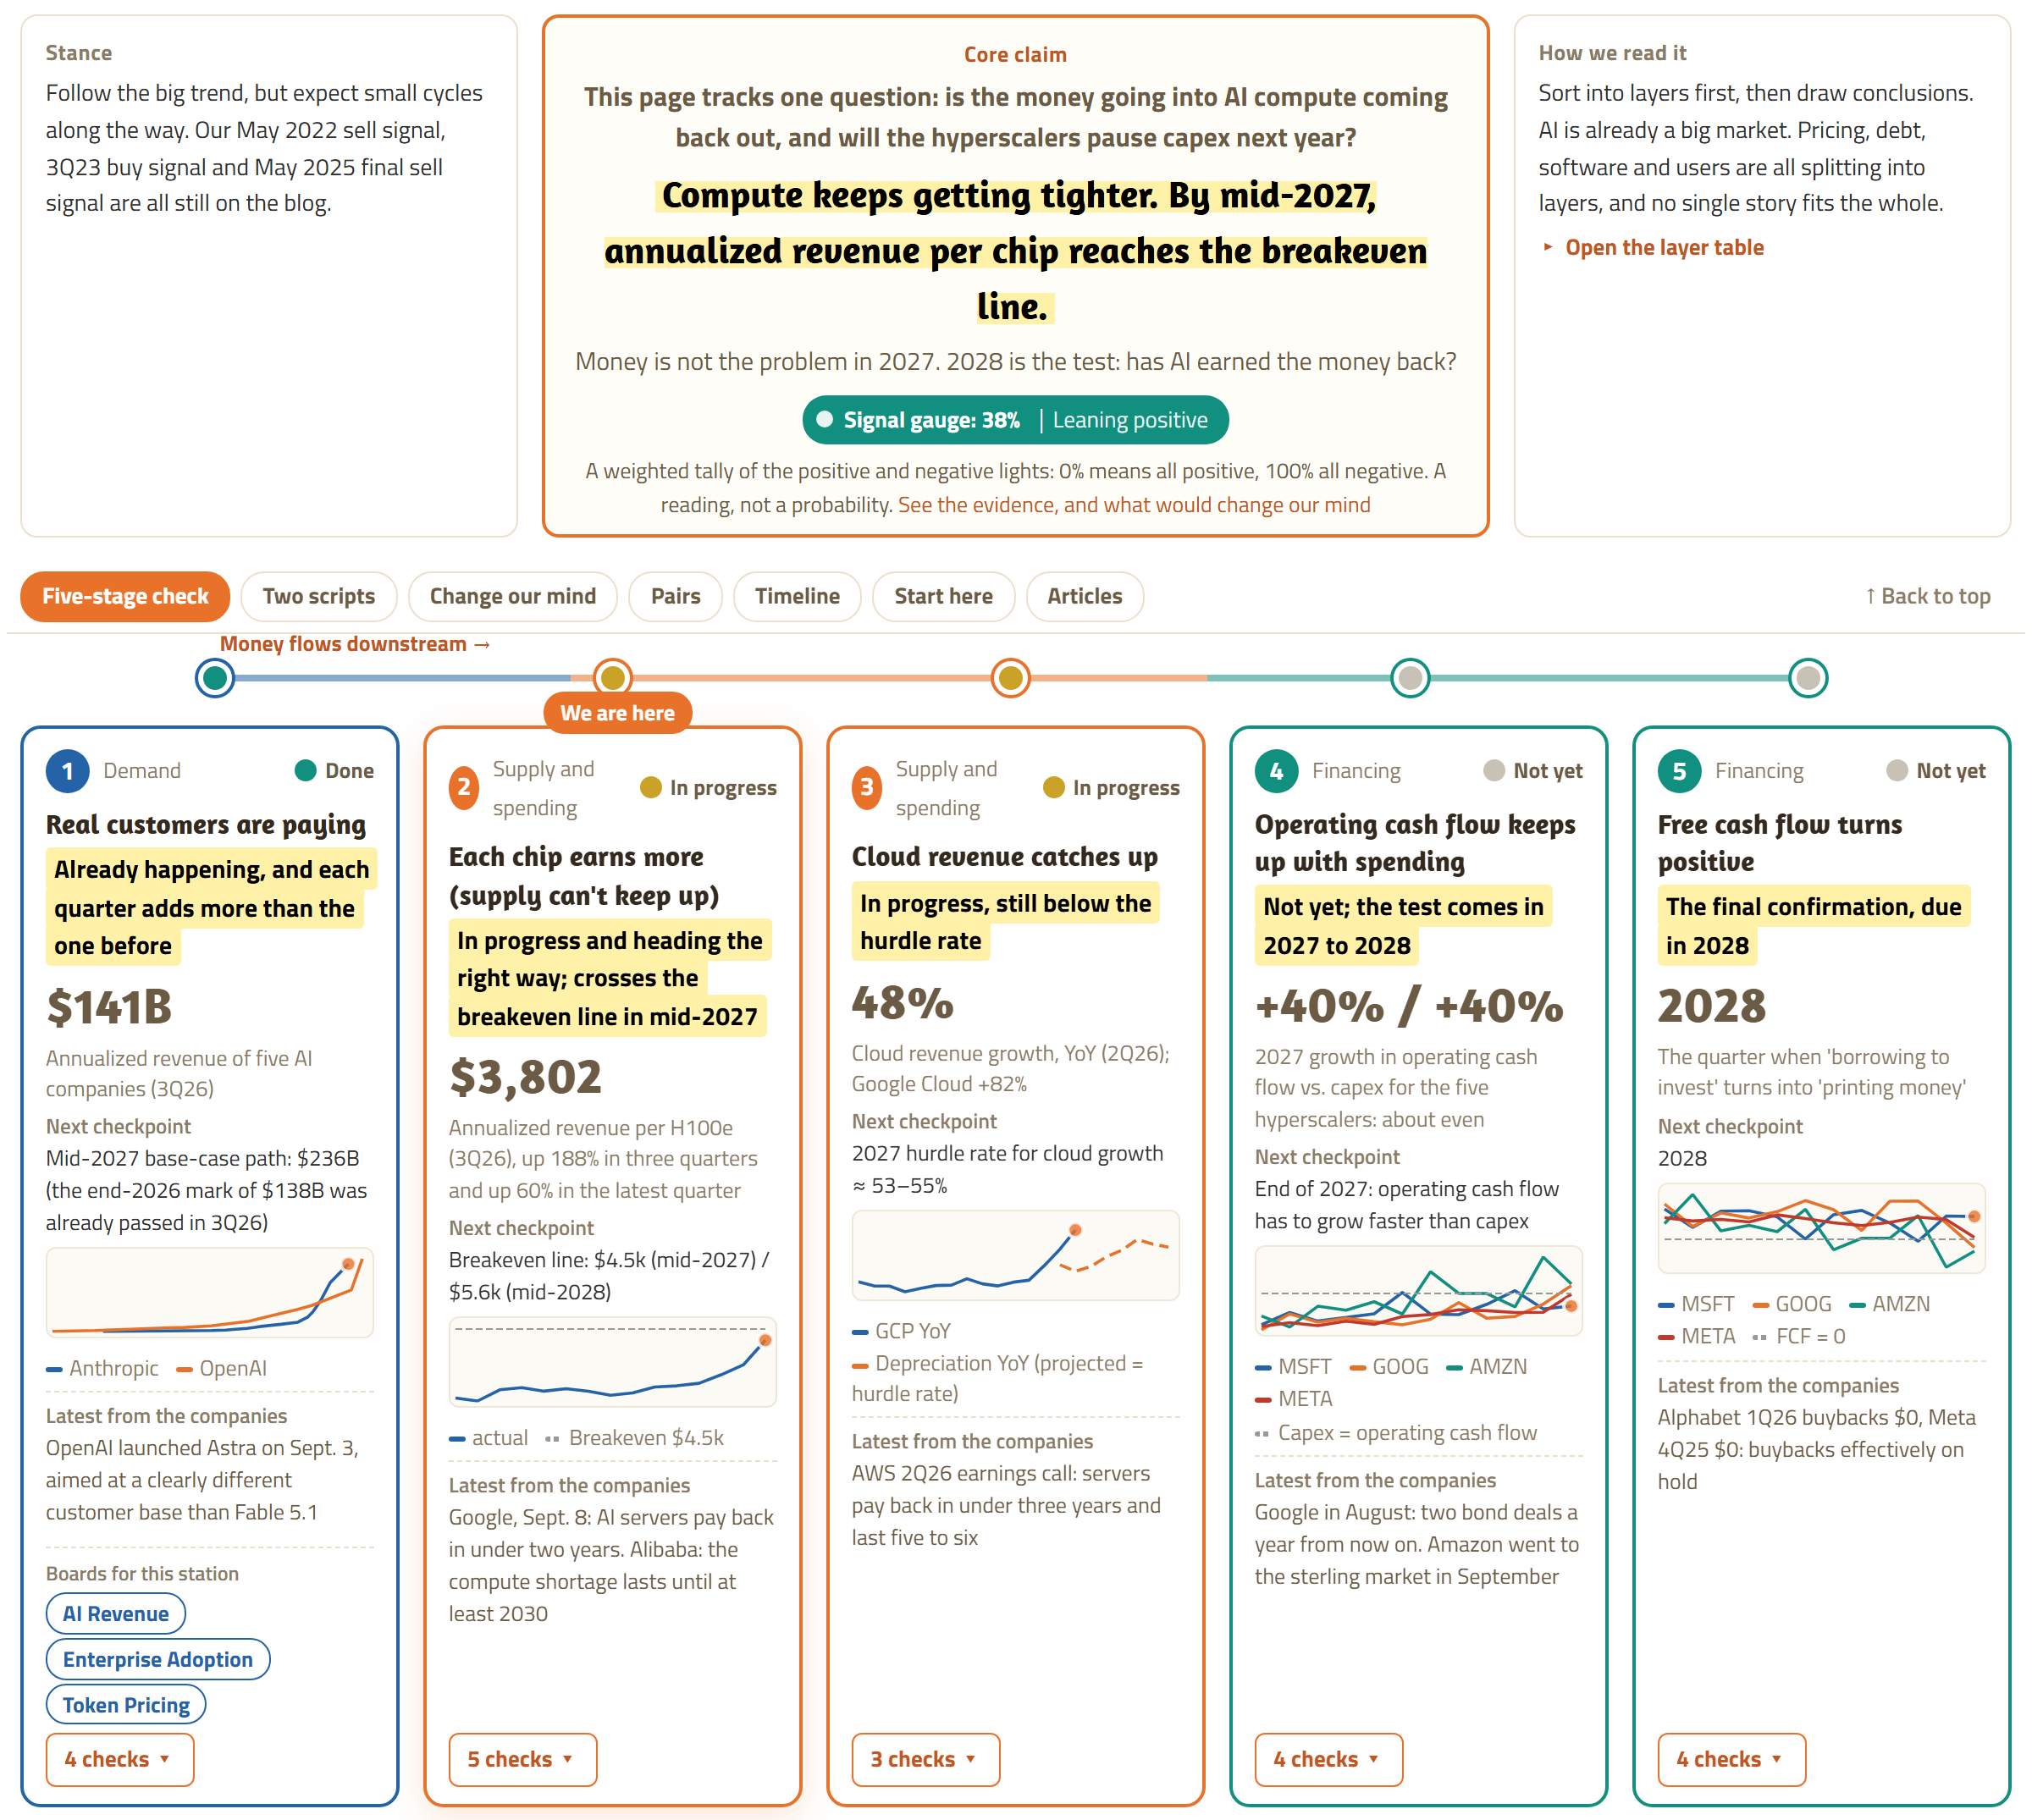
Revenue per AI chip hit $3,800 in 3Q26, 30% above our July path. AI compute could reach the $4,500 breakeven line by year-end, two quarters early.
The AI Buildout Scorecard is live.
Key takeaways
- AI revenue stepped up on schedule: annualized revenue at five AI companies hit $141.1B in 3Q, already past the $138B our July base path had for year-end. OpenAI is near $70B, up about 70% since the start of the quarter.
- Revenue per chip came in at $3,800 in 3Q, about 30% above the $2,900 on our July path and only about 15% short of the $4,500 breakeven line.
- Supply also came in higher (3.14GW of new US data center capacity in 1H27, versus 1.41GW in July), so compute is now tight because demand is running ahead. We think that is the sturdier kind of tight, and rents are still rising.
- Updated script: breakeven by year-end 2026, two quarters earlier than the mid-2027 we called in July. The late-October earnings season and Anthropic's November IPO prospectus are the next checks.
Since mid-July we have written eleven AI pieces, all built around one call: AI compute will only get tighter, and annualized revenue per chip (per H100-equivalent chip, H100e) will reach the breakeven line next year. The breakeven line is the level where a newly built data center starts to pay for itself. Along the way we also took on, one by one, the worries the market has fought over these past few months: Is AI revenue topping out? Will AI eat software? Who is carrying the debt?
All of those pieces hang on one framework, our AI Buildout Scorecard. Money leaves the customer, makes a loop and comes back to the cloud companies, with five stations along the way and one number at each station. We have put it together and posted it on the site, and the numbers on it update as new data comes in.
With the Scorecard going live, we also used the latest end-of-September numbers to check where the script we wrote in July stands.
The answer: stronger than we projected. AI companies' revenue has stepped up, and revenue per chip is now just short of the breakeven line. The breakeven we had projected for mid-2027 could come by year-end on today's numbers. The odds favor the virtuous cycle. In the coming earnings season, whether cloud revenue moves higher again decides whether the script takes its next step.
How the Scorecard works
The backbone is a loop of money. Customers pay AI companies. AI companies use that money to rent compute. The cloud companies that own the compute grow revenue. Their operating cash flow keeps up with their capex. In the end there is money left over after spending (free cash flow turns positive), and it goes into the next round.
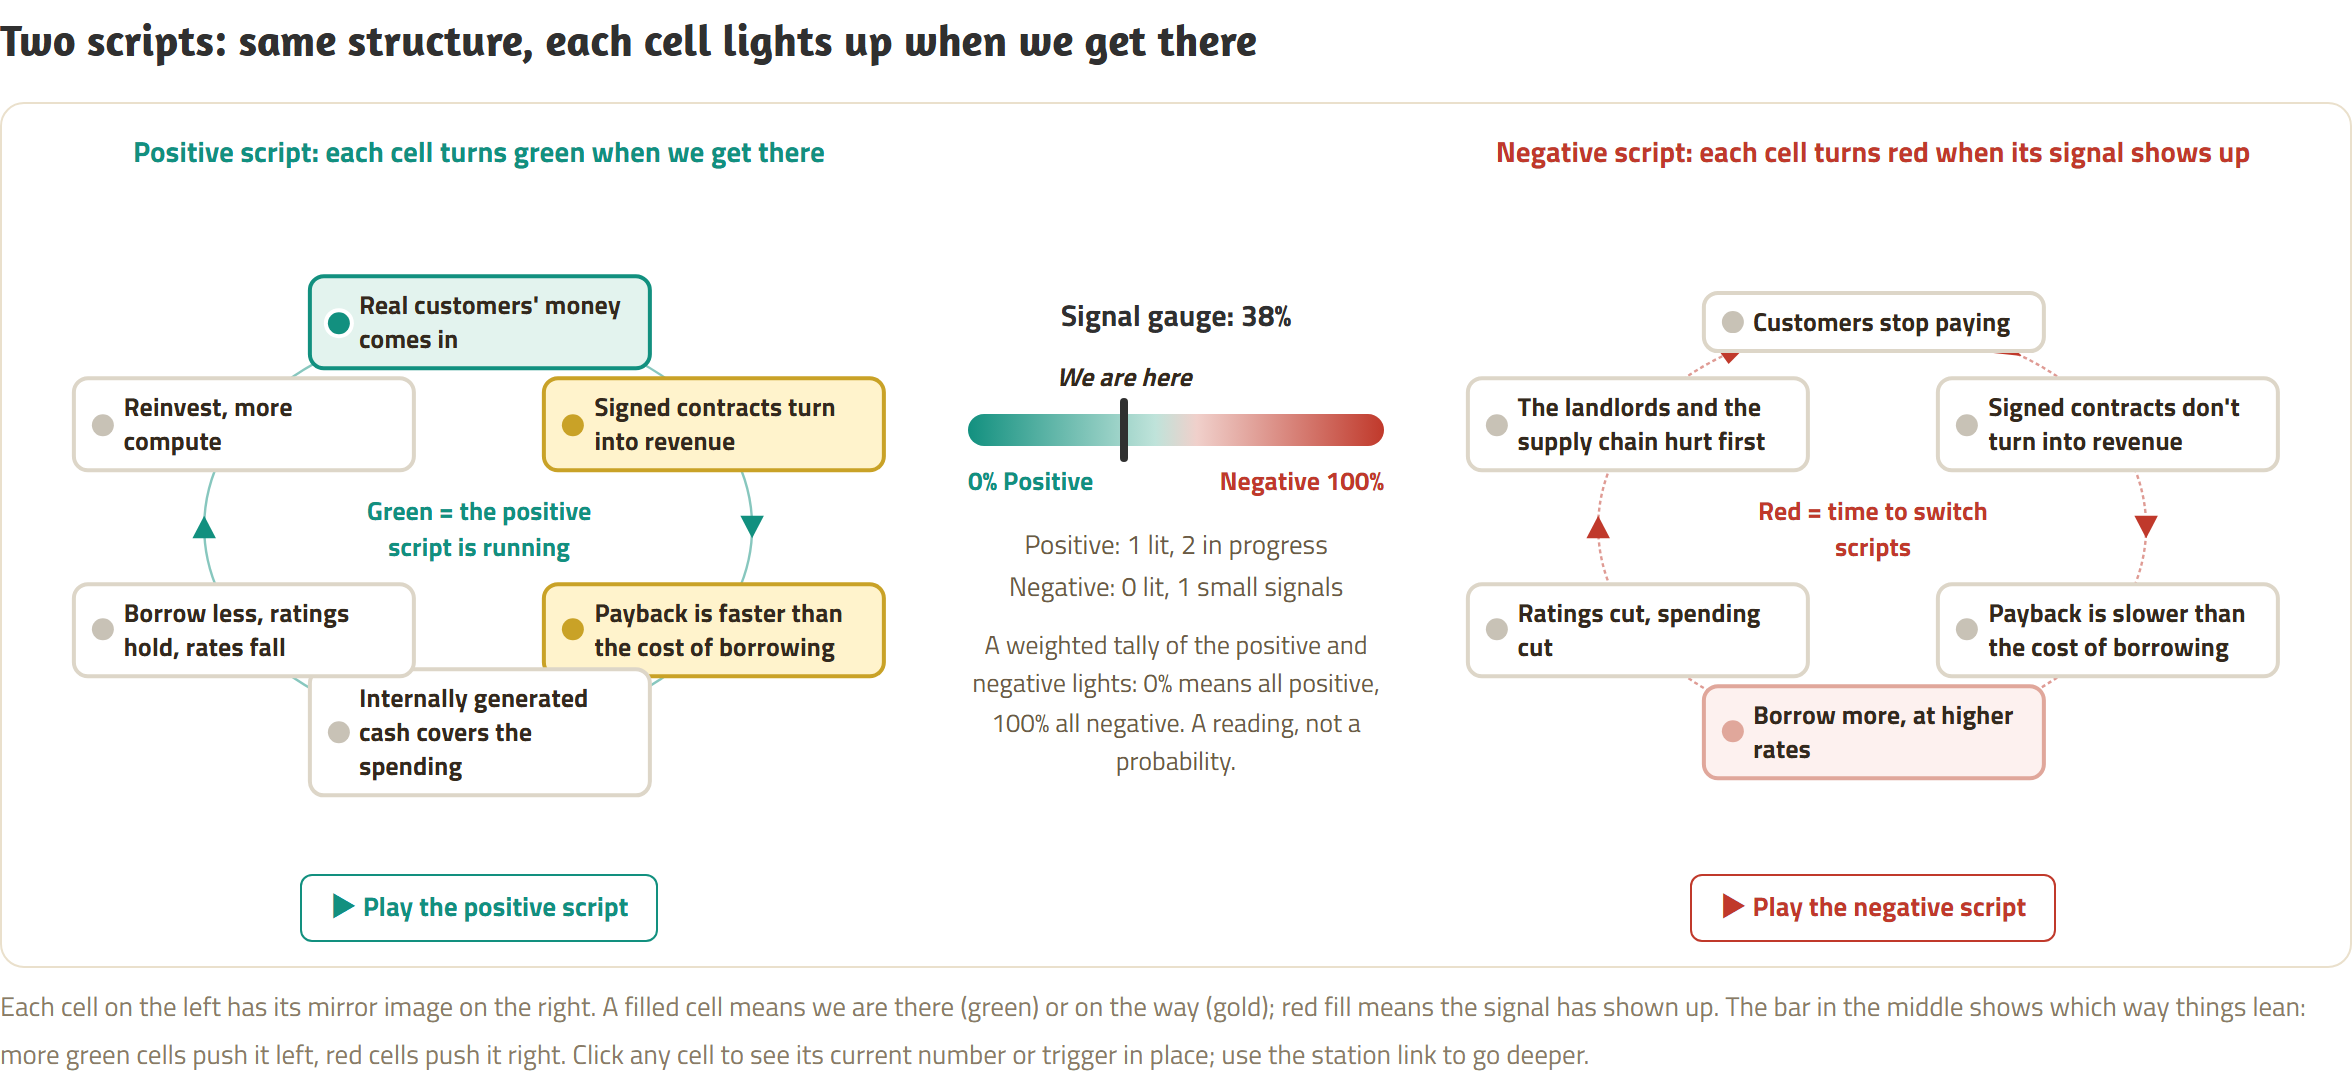
The five stations on the site are those five steps: Station 1: Real customers are paying; Station 2: Each chip earns more (supply can't keep up); Station 3: Cloud revenue catches up; Station 4: Operating cash flow keeps up with spending; and Station 5: Free cash flow turns positive. Each station shows just one number, the date of the next check, and the latest quote from the companies. Green means already happening, yellow means in progress, and gray means not yet. Right now the board reads one green, two yellow, two gray.
Under each station sit two scripts: the virtuous cycle and the vicious cycle. In the virtuous cycle, the five steps play out one after another. The vicious cycle is the same structure run in reverse: customers stop paying, signed contracts don't turn into revenue, payback is slower than the cost of borrowing, companies borrow more at higher rates, ratings get cut and spending gets cut, and in the end the landlords (colocation and neocloud owners) and the supply chain hurt first. Whichever box lights up tells you which script we are on.
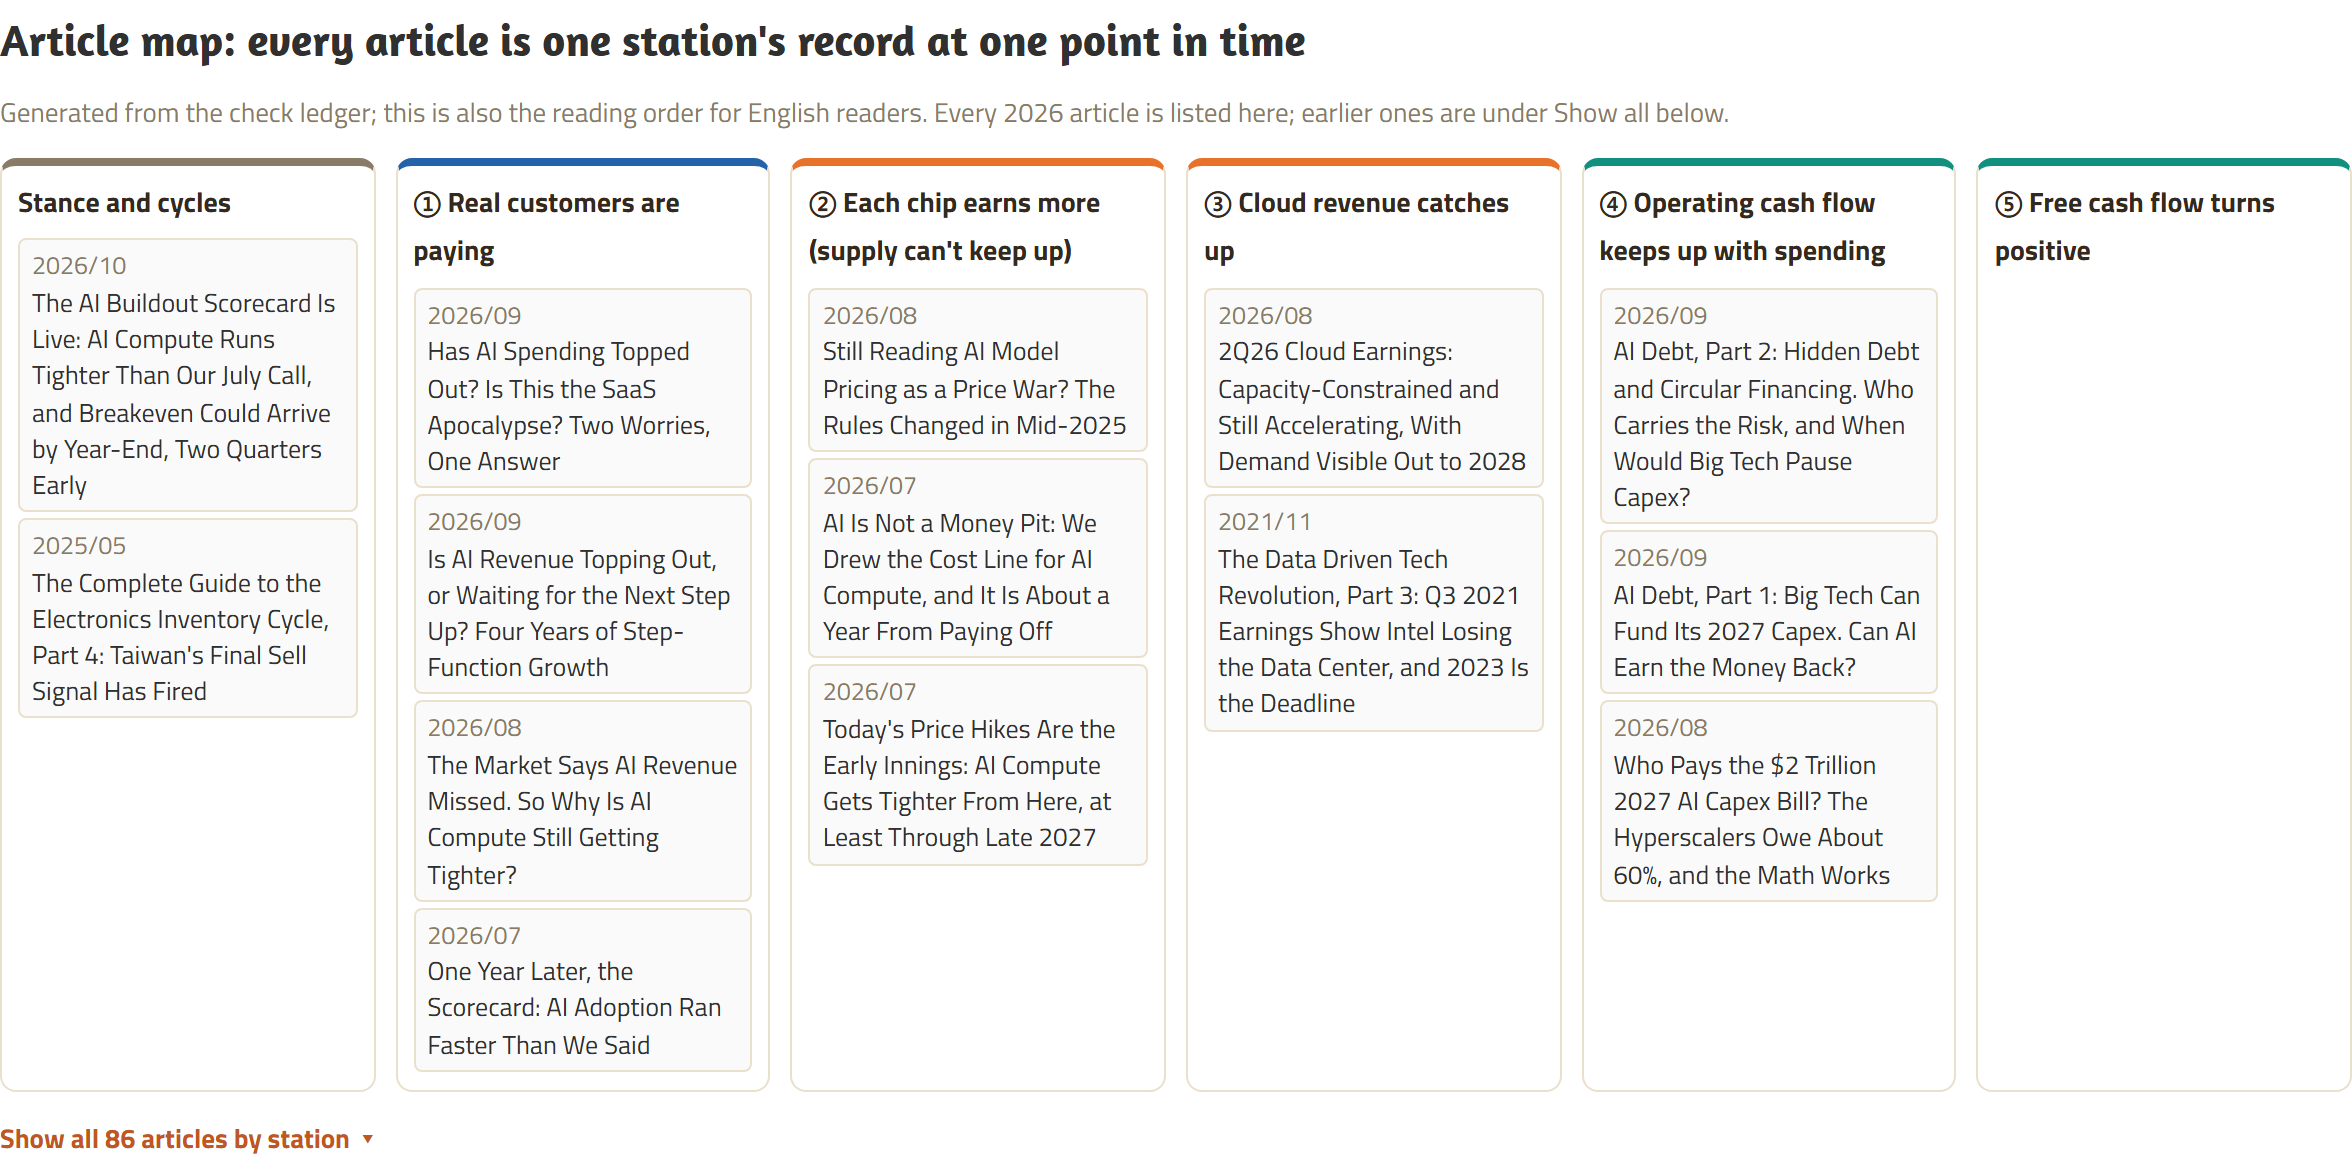
Our past research pieces are all parts of this Scorecard. The pieces on the revenue step-up and on checking annualized revenue (ARR) against our calls sit at Station 1 ("Is AI Revenue Topping Out, or Waiting for the Next Step Up?" Sept. 3, and "The Market Says AI Revenue Missed," Aug. 31). The compute shortage, breakeven and pricing pieces sit at Station 2 ("Today's Price Hikes Are the Early Innings," July 17; "AI Is Not a Money Pit: We Drew the Cost Line," July 22; and "Still Reading AI Model Pricing as a Price War?" Aug. 25). The cloud earnings piece sits at Station 3 ("2Q26 Cloud Earnings," Aug. 11). The piece where we backed into capex from the supply chain and the debt pieces sit at Station 4 ("Who Pays the $2 Trillion 2027 AI Capex Bill?" Aug. 3; "AI Debt, Part 1" and "AI Debt, Part 2," Sept. 21 and Sept. 28). Every new piece from here on will be tagged with its station.
We are adding the Scorecard's data pages one at a time. Three are live so far: Where the ARR Comes From, Token Prices and Enterprise Adoption. We will walk through them once the set is more complete.
The Chinese original of this article is at blog.finsight.investments.
Walking the Scorecard: where the numbers stand now
Station 1, real customers are paying: OpenAI steps up on schedule
When we wrote "Is AI Revenue Topping Out, or Waiting for the Next Step Up?" (Sept. 3), OpenAI had grown just 18% in the second quarter. Our view then: revenue is the last place it shows up, but the early signals were already there. ChatGPT Work launched in July, and the top 1% of companies, the heaviest AI users, were spending more again. The slowdown was just a company waiting for the next step up.
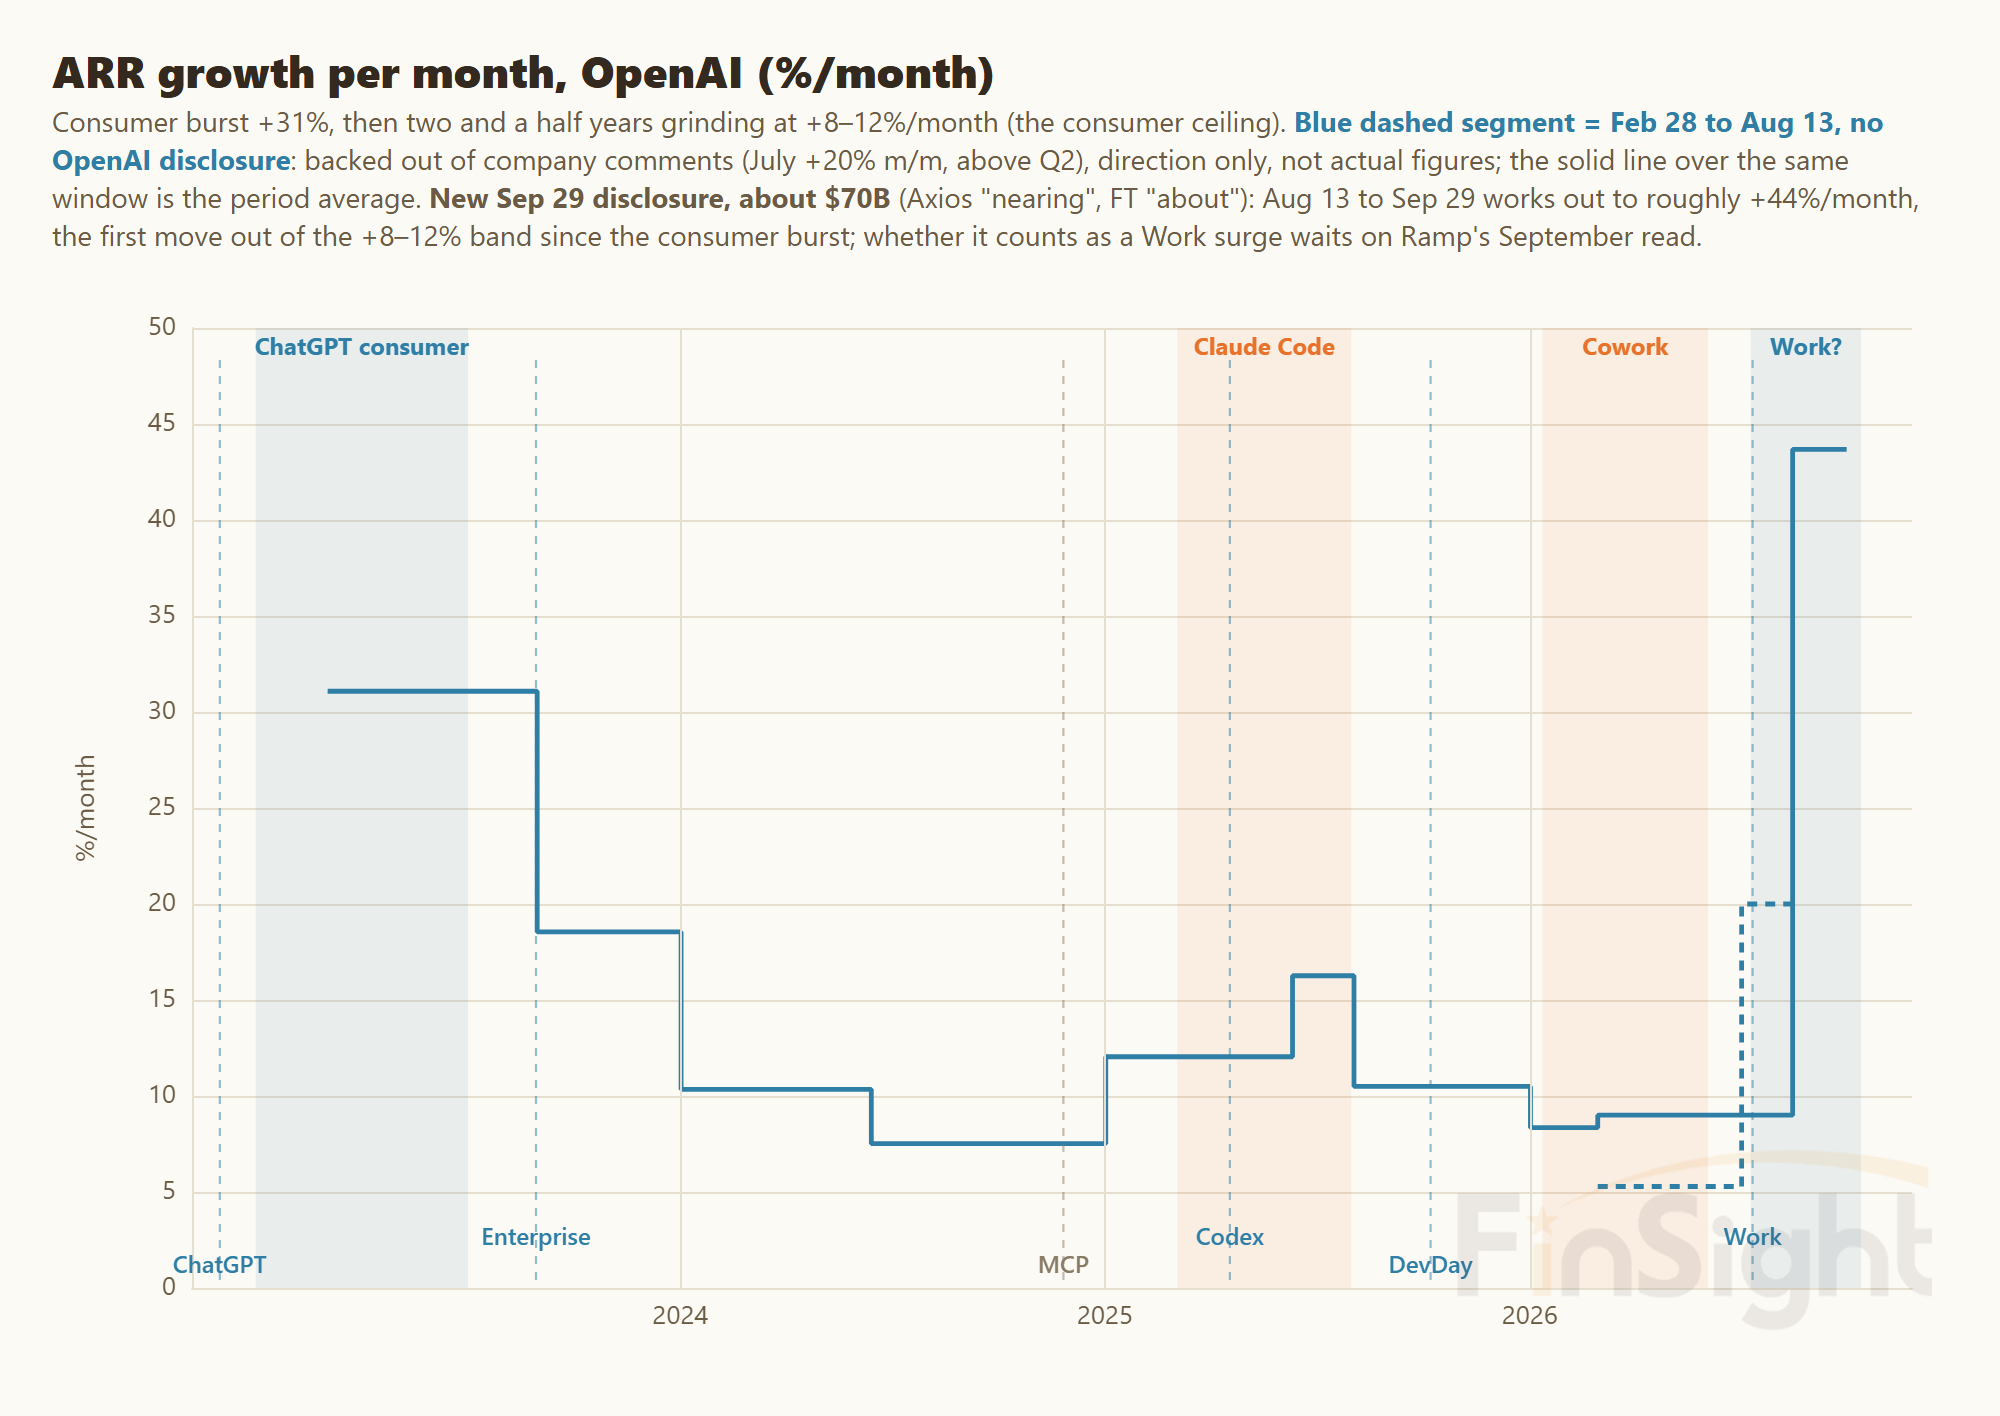
In late September, the next step up arrived. Axios, citing people familiar with the matter, reported that OpenAI's annualized revenue (the latest month's revenue times 12) is close to $70B. That is up about 70% from the start of the third quarter, and the enterprise business more than doubled. On the four-year chart, the annualized revenue OpenAI and Anthropic have added so far in 2026 is already several times what they added in 2023 through 2025 combined.
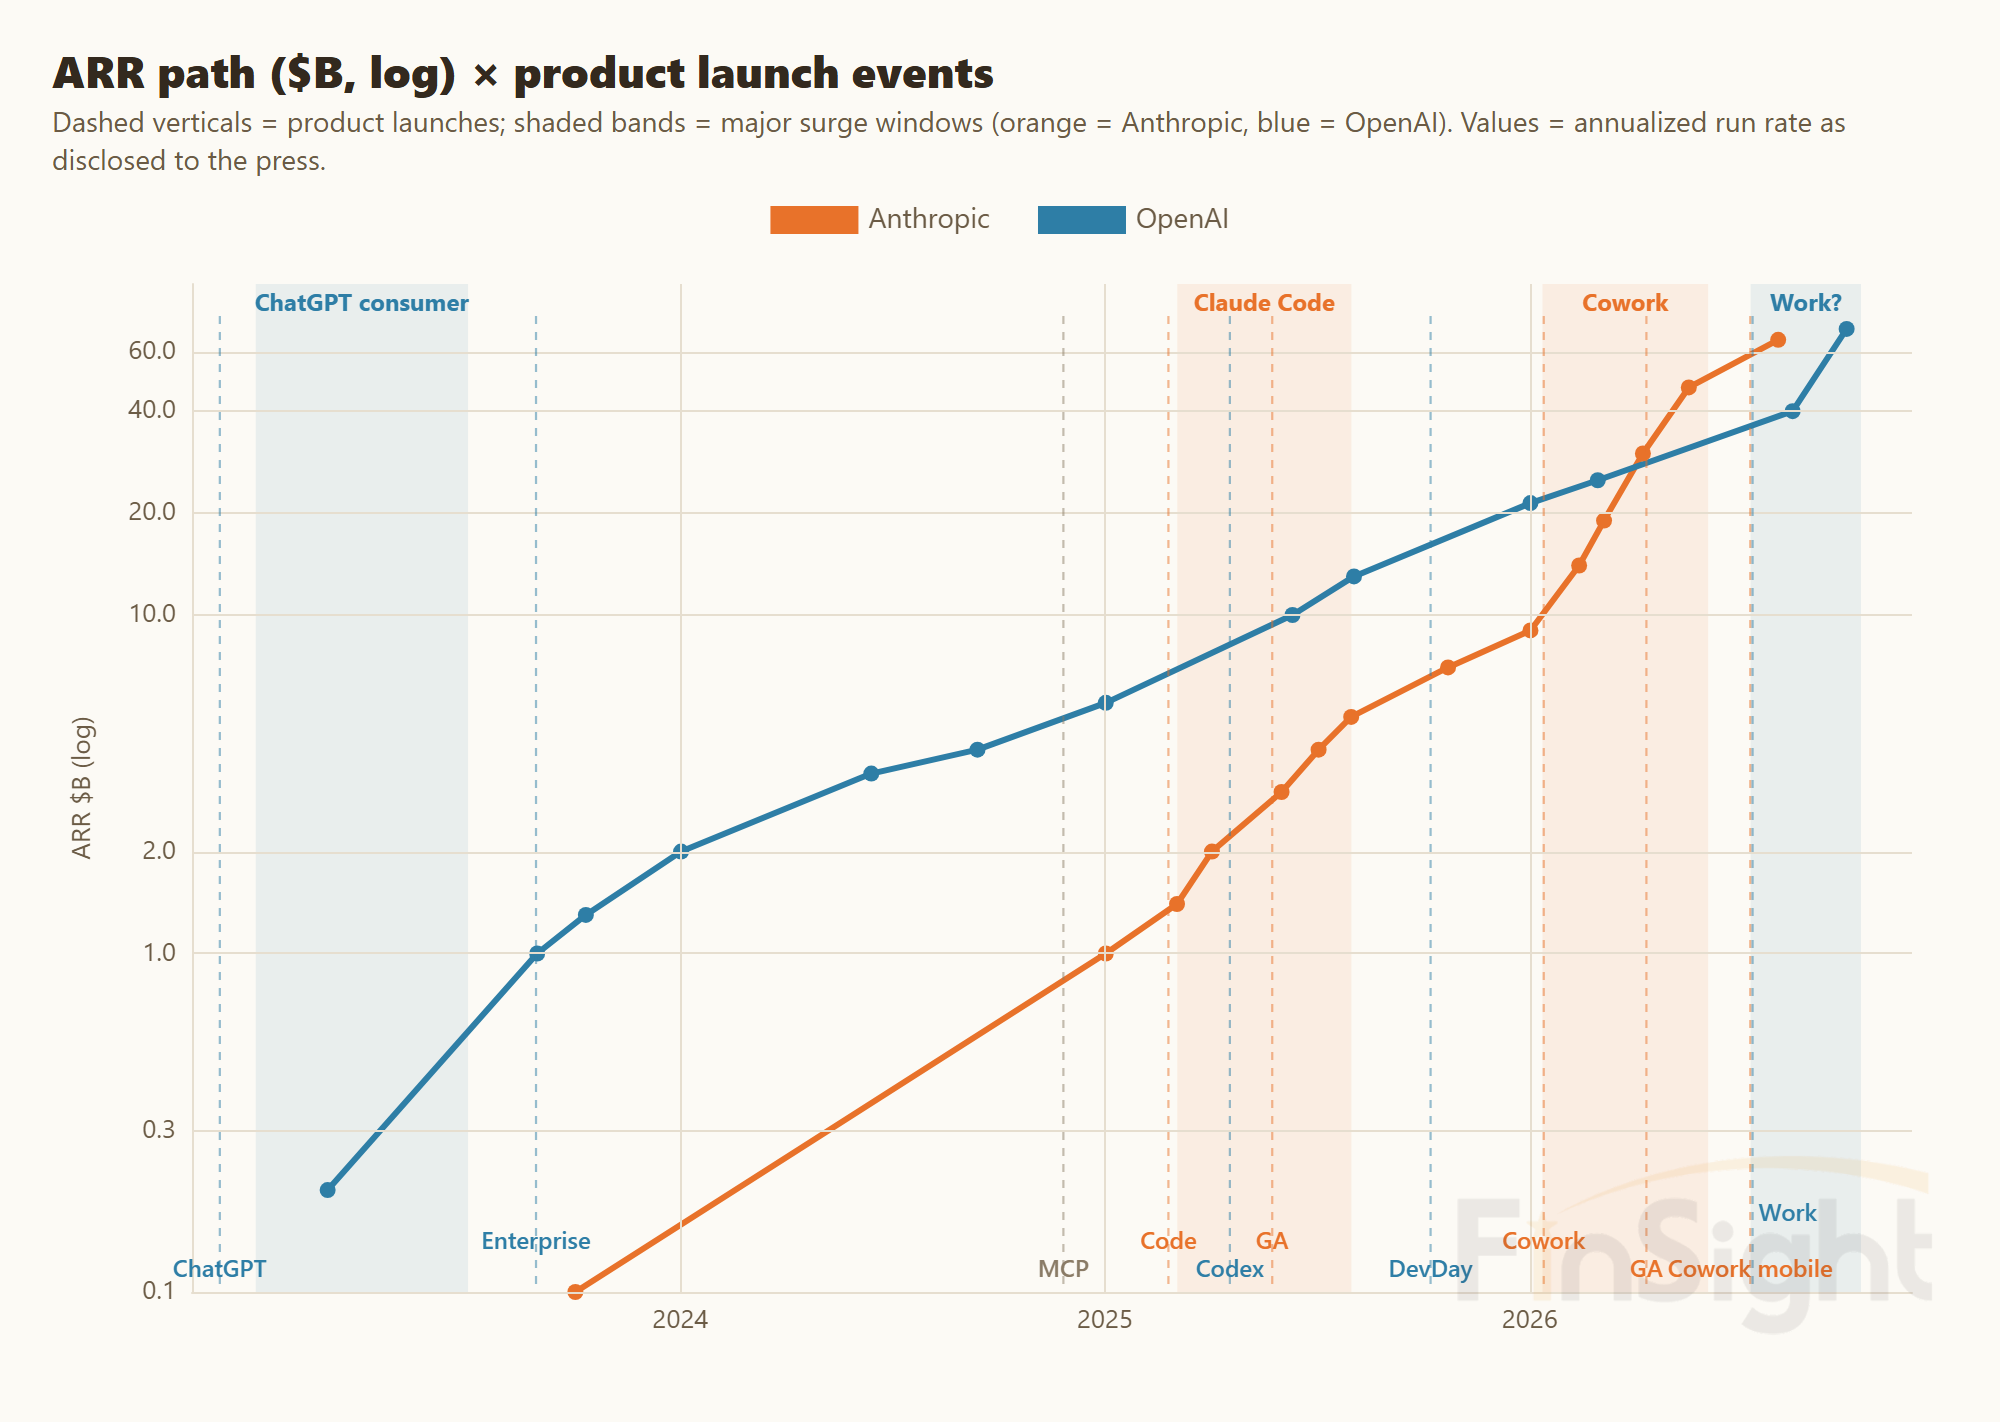
On a monthly basis, that works out to growth of about 19%. For the past two and a half years, OpenAI has grown 8% to 12% a month. This is the first time it has broken out of that range.
Across the five AI model companies we track (OpenAI, Anthropic, xAI, Mistral and Zhipu), annualized revenue hit $141.1B in the third quarter. In September they passed the $138B that our July base path had them reaching only by year-end. We still carry Anthropic at the $65B it announced in late July. Its IPO prospectus in November will carry audited figures, and consensus is for a run rate of at least $100B, so Station 1 should move higher once that number lands.
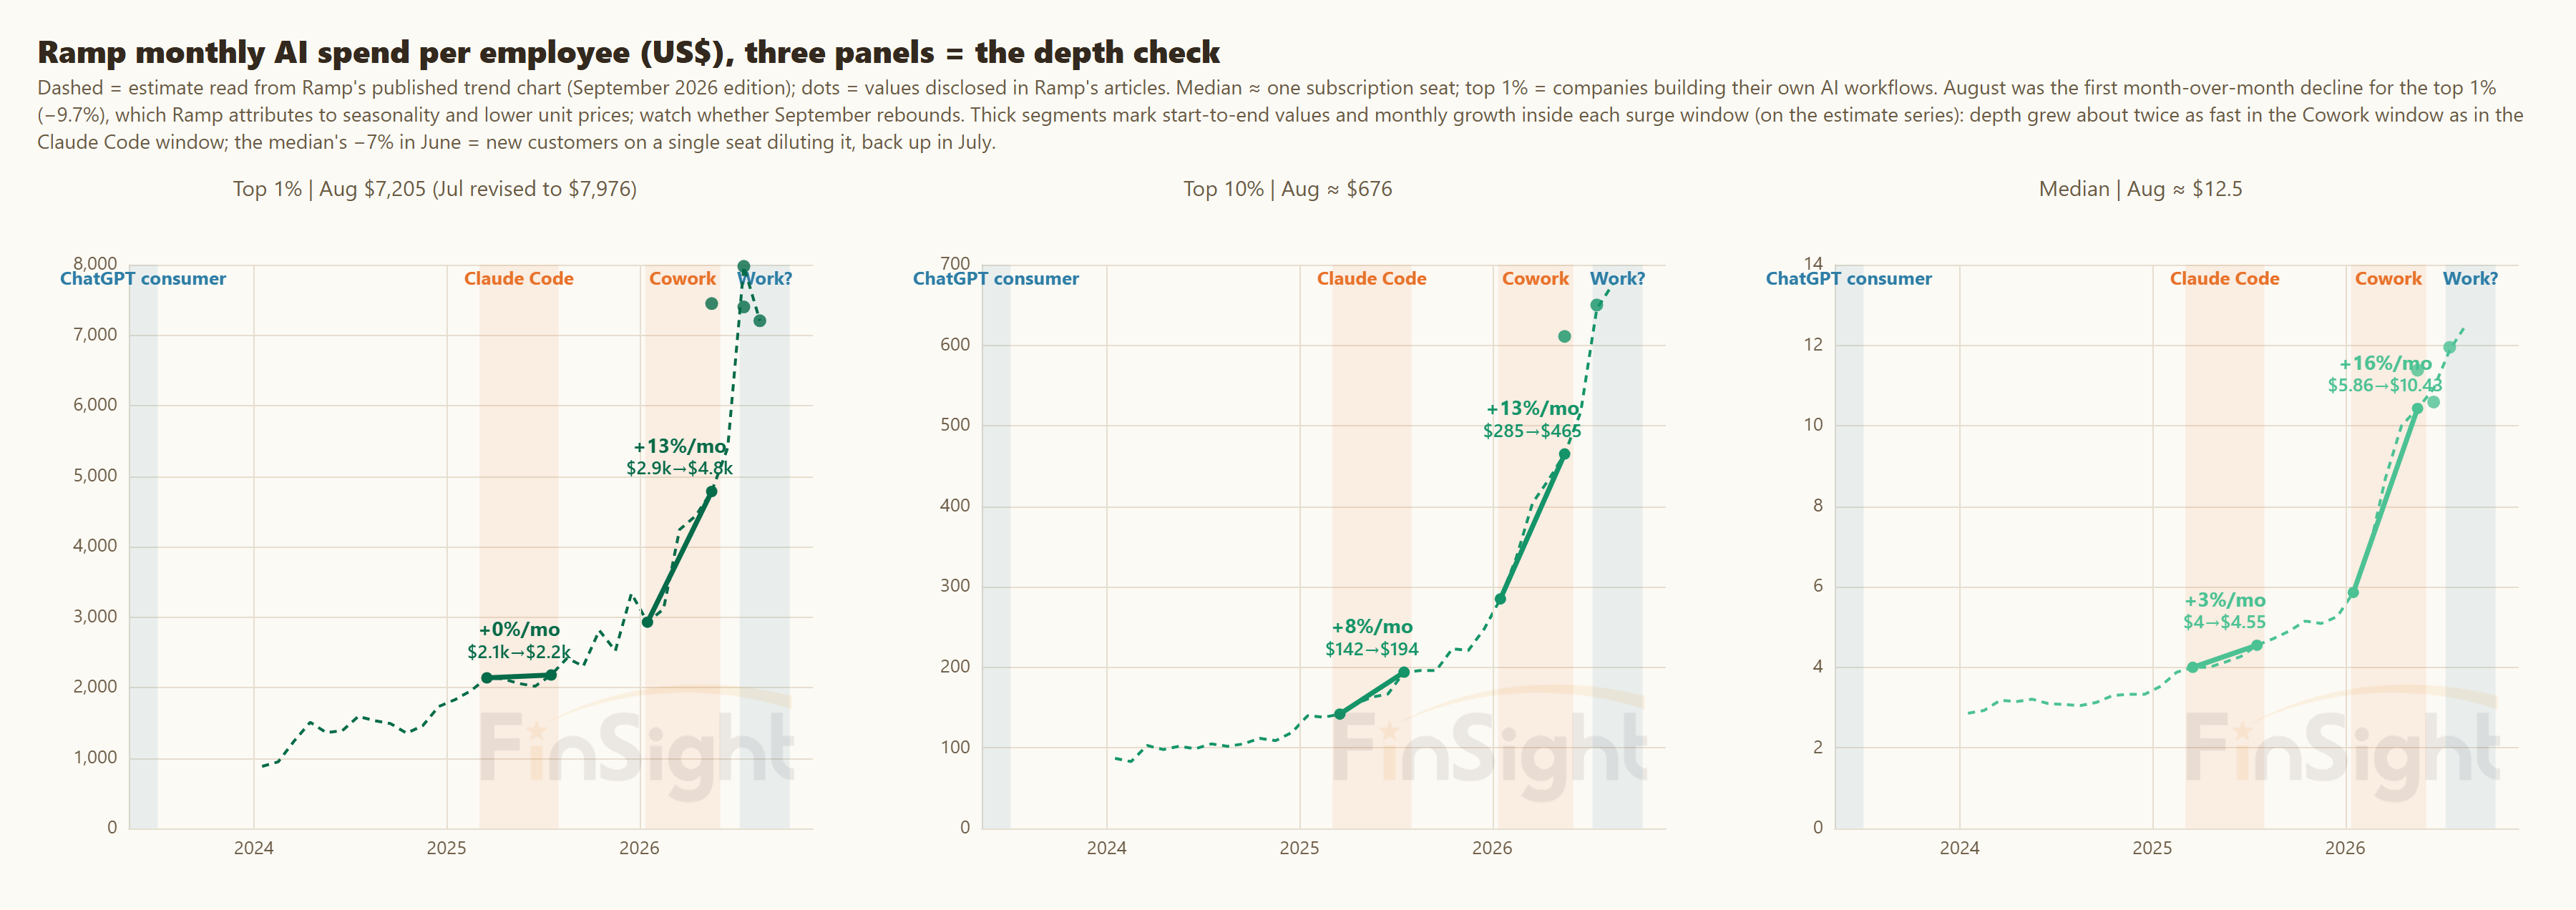
What about the heaviest AI users? They are the early signal for the next step up, and we track them with Ramp's corporate card data (Ramp is a US corporate card company that publishes monthly data on what businesses spend on AI). At the top 1% of companies, monthly AI spend per employee fell month over month for the first time in August, from $7,976 to $7,205. Ramp pointed to summer plus model price cuts. The top 10% and the companies in the middle are still climbing. September's number will tell us whether this was just summer or a real pullback.
Station 2, each chip earns more: just short of the breakeven line
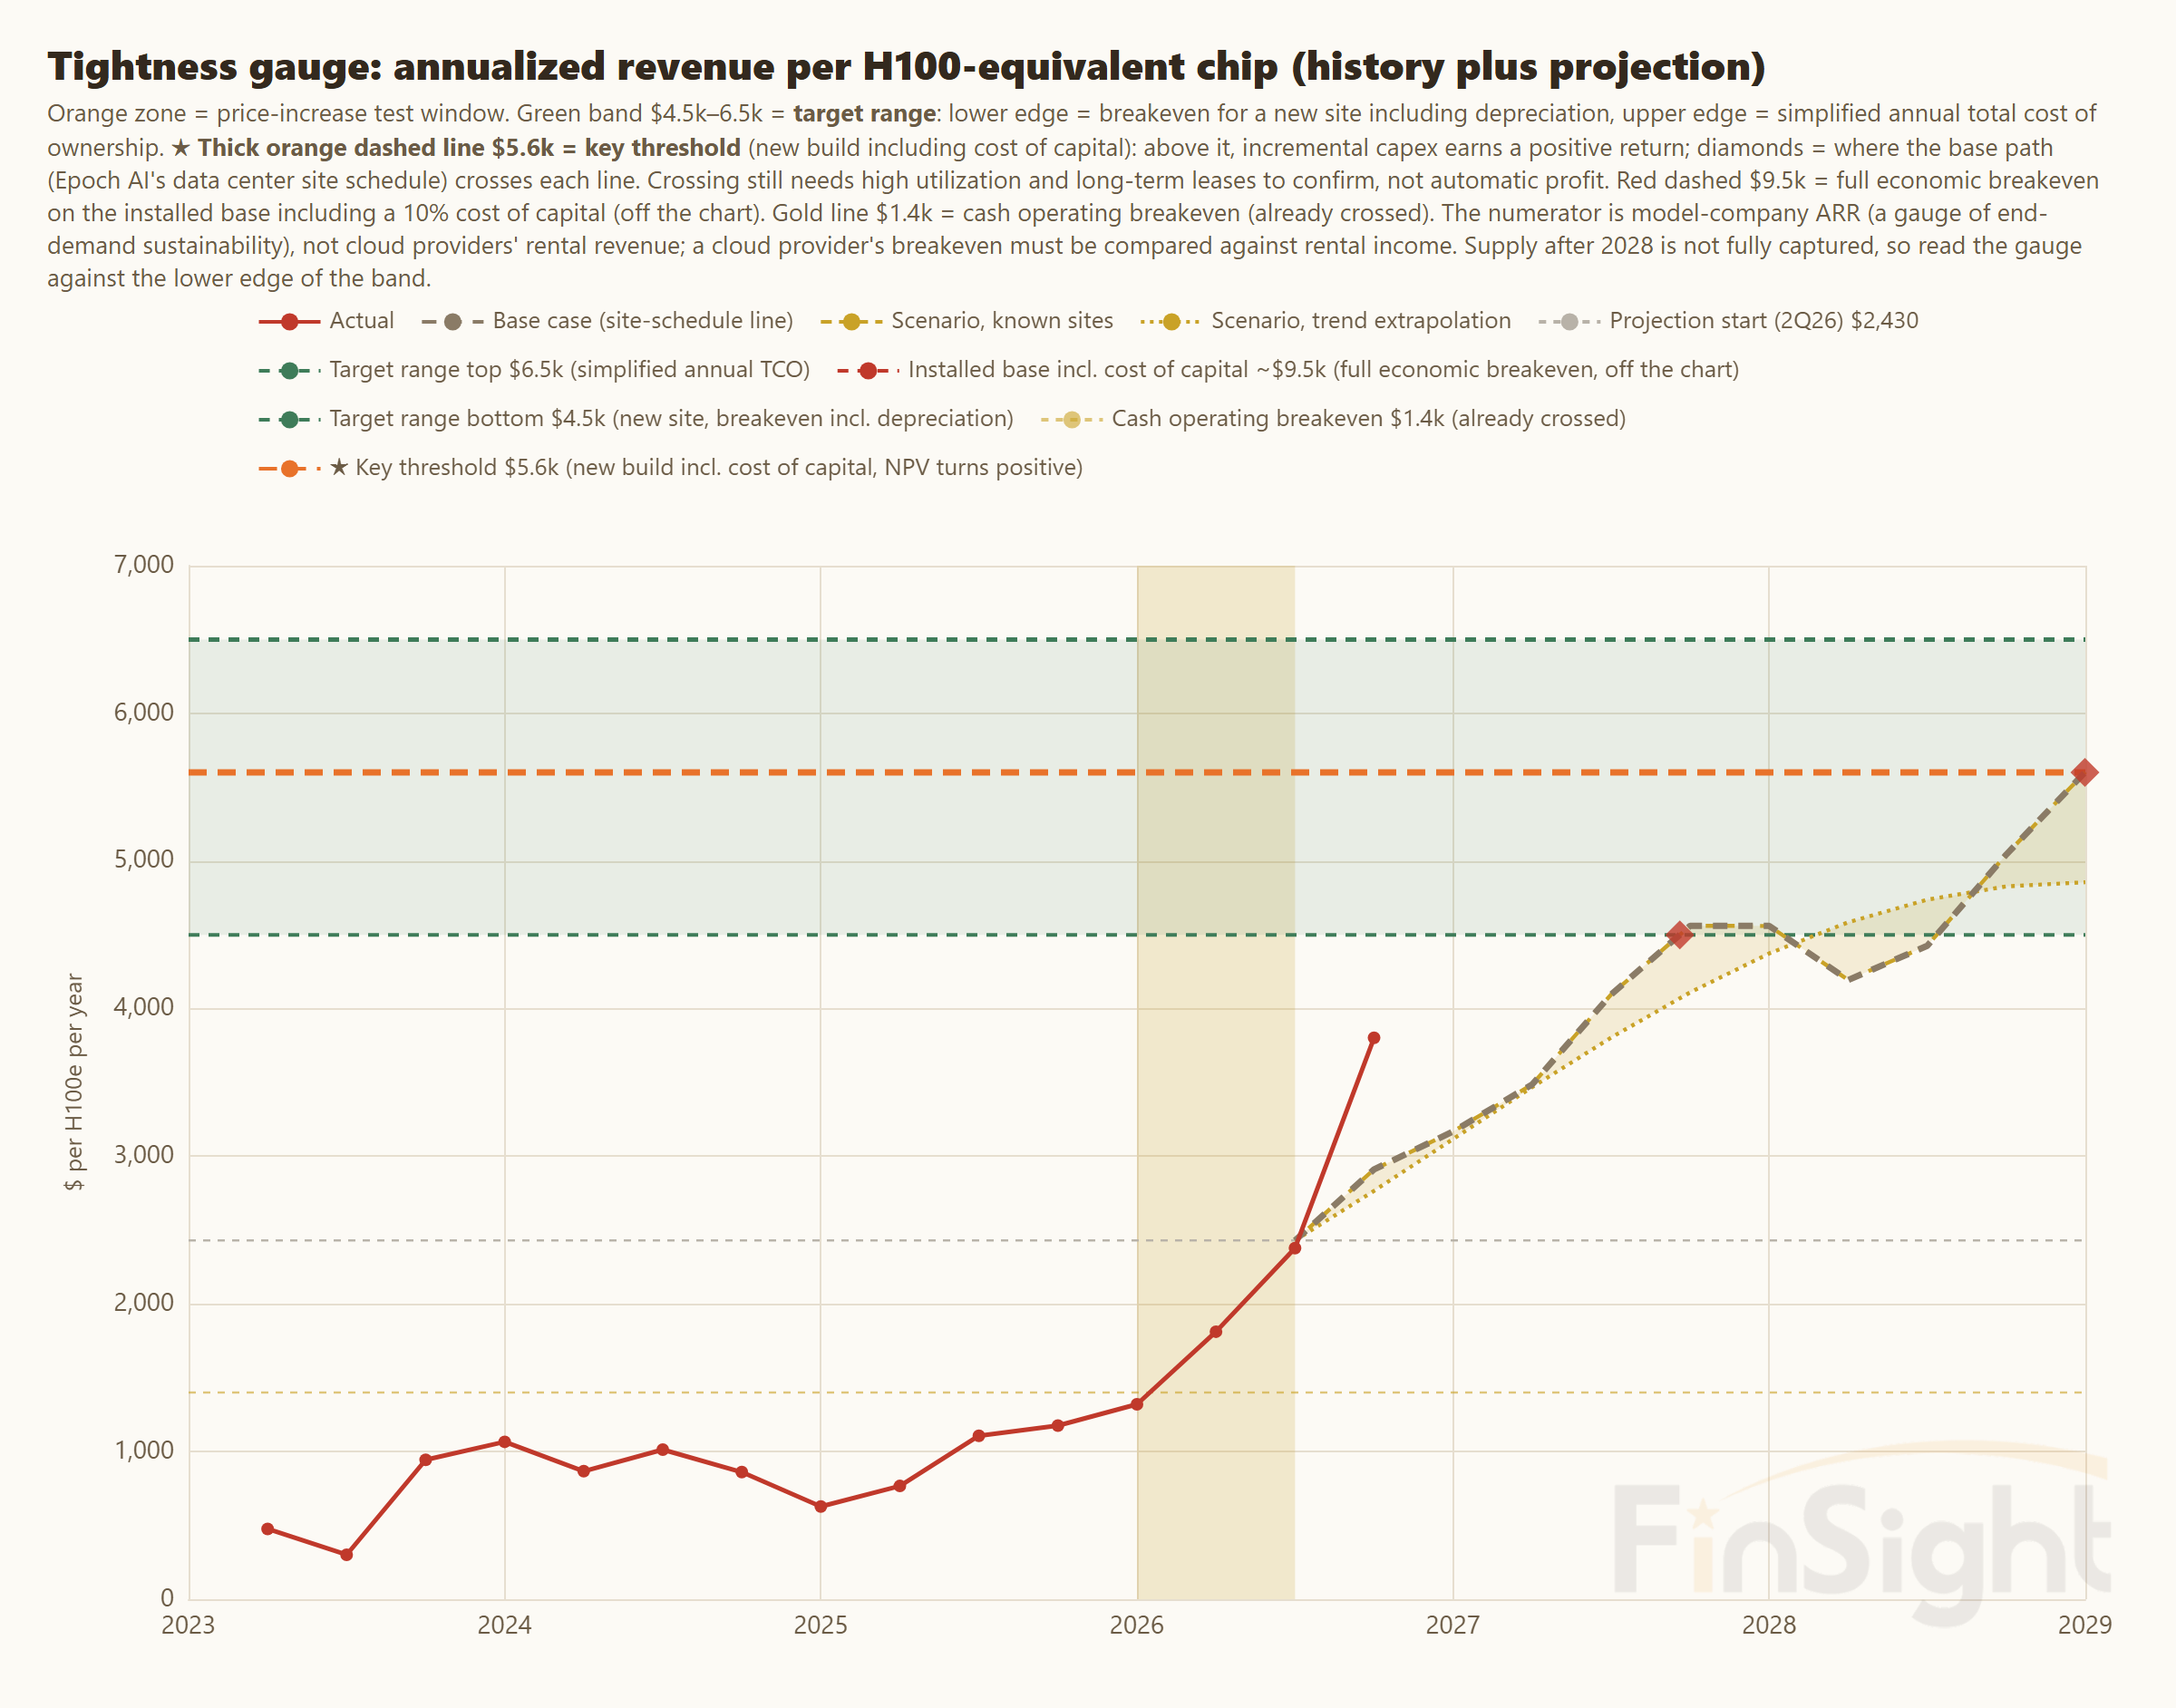
"Today's Price Hikes Are the Early Innings" (July 17) and "AI Is Not a Money Pit: We Drew the Cost Line" (July 22) are where this whole script started. The numbers then: annualized revenue per H100-class chip was $2,430 in the second quarter. The breakeven line for a newly built data center was $4,500: at that level a new data center covers its costs, depreciation included. The expansion sweet spot was $5,600: that level also covers a 10% cost of capital, so building more makes sense. At the pace back then, revenue per chip would reach breakeven in mid-2027.
Three months later, revenue per chip came in at $3,800 for the third quarter: $141.1B in annualized revenue at the five companies, divided by the 37.1 million H100-equivalent chips installed across the market to date, based on data from Epoch AI (a research group that tracks AI chips and data centers). The numerator is the five companies' revenue and the denominator is every chip in the market, so this is a deliberately strict measure. The chips can be counted two ways: Epoch AI's own tally, which lags for the latest quarter, or our estimate that fills that gap from chip shipment run rates. This time we used our gap-filled estimate, which gives the higher chip count and so the lower, more conservative revenue per chip. The details are on our Epoch AI tracking page.
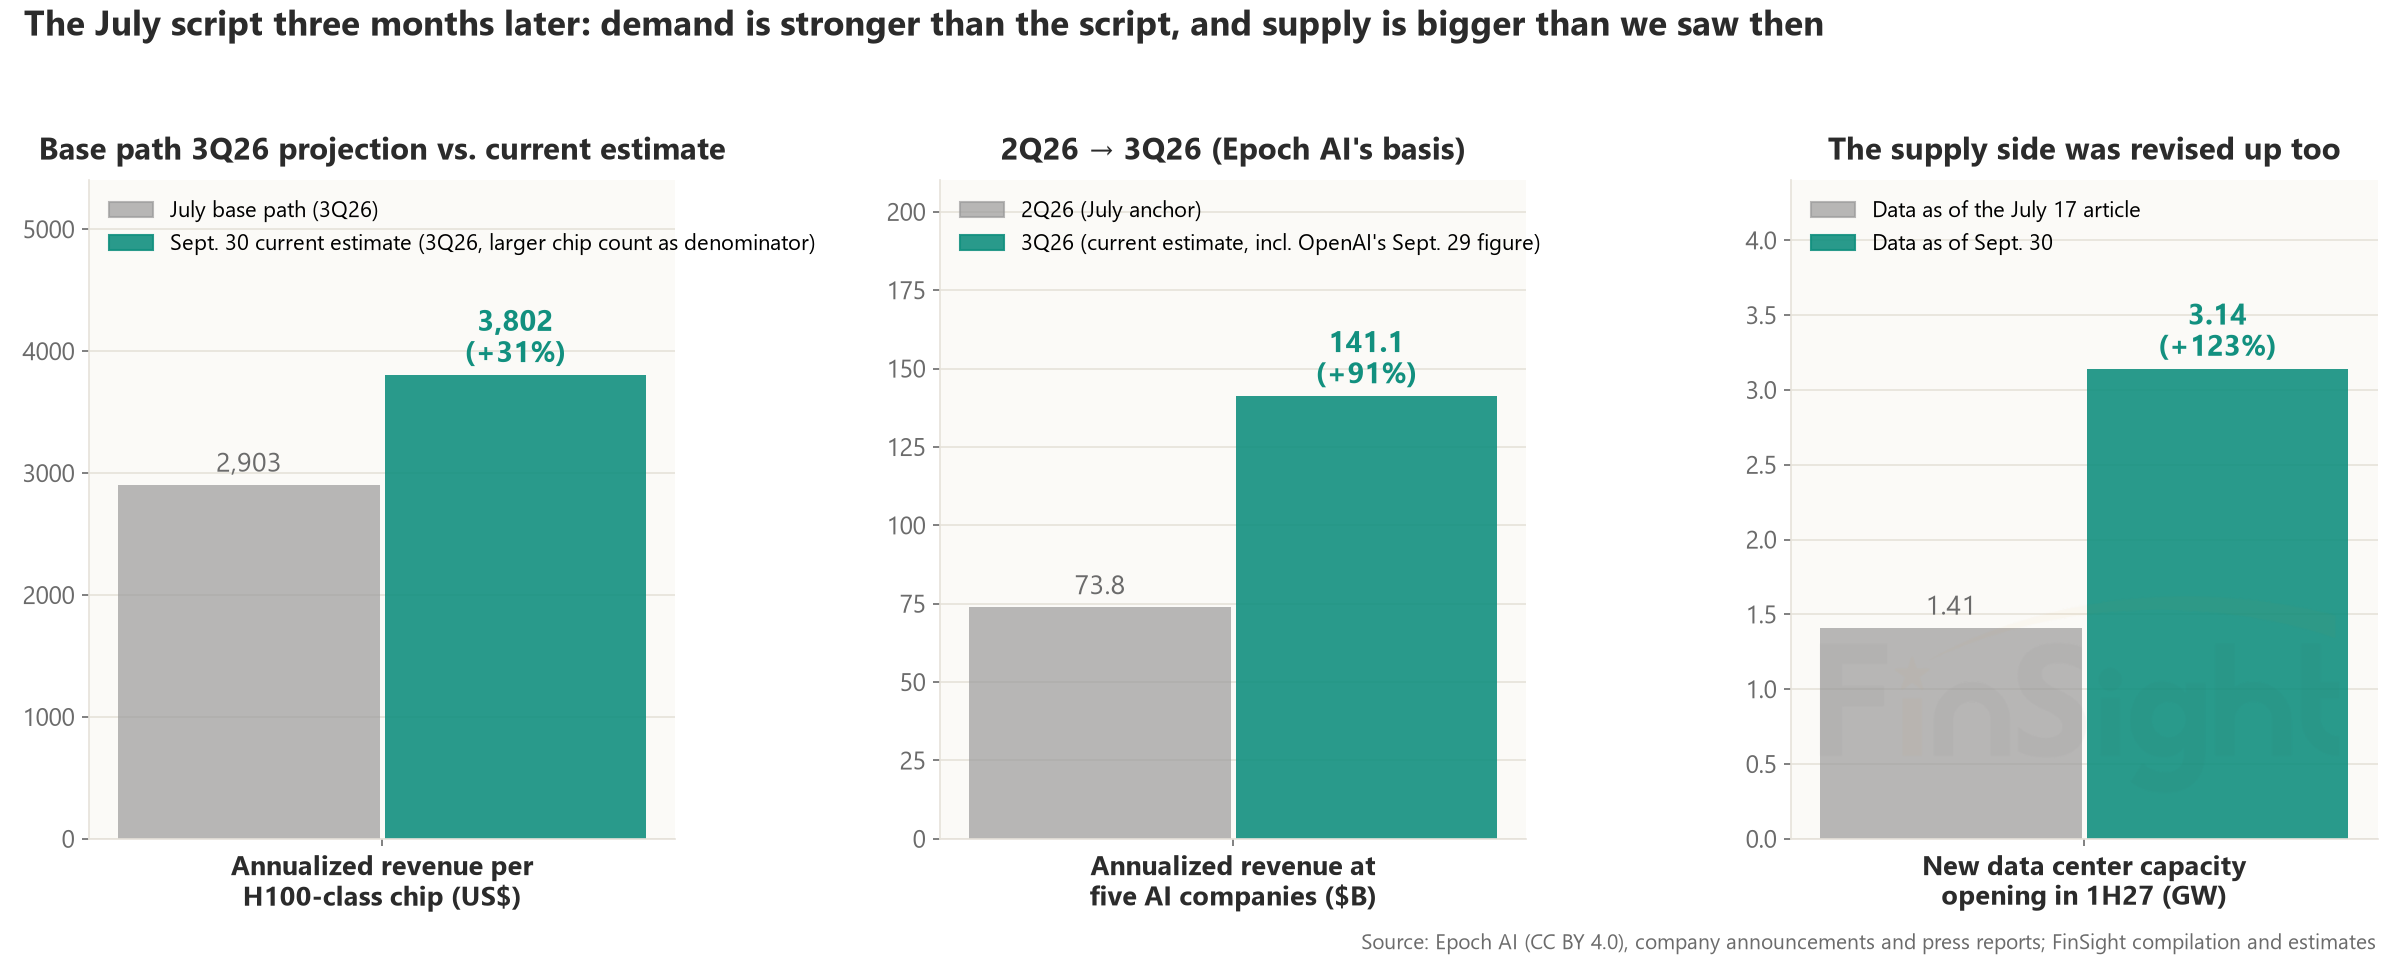
Our July path had $2,900 for the same quarter, so the actual number is about 30% higher. That is a level our July path didn't expect until early 2027, and it is only about 15% short of the $4,500 breakeven line.
More data centers than we saw in July, but surging demand is what keeps compute tight
In mid-July we said new data center capacity opening in the first half of 2027 was only 1.41GW, the smallest half-year since 2023. Over the past three months, satellite imagery has picked up new sites breaking ground, and the same dataset now shows 3.14GW, more than double the July figure. On the full timeline, though, it is still lower than the halves on either side: 4.5GW opens in the second half of 2026 and 4.4GW in the second half of 2027, and the real wave doesn't hit until the first half of 2028, at 7.2GW. So the first half of 2027 is still a dip in supply, just not as deep as it looked in July.
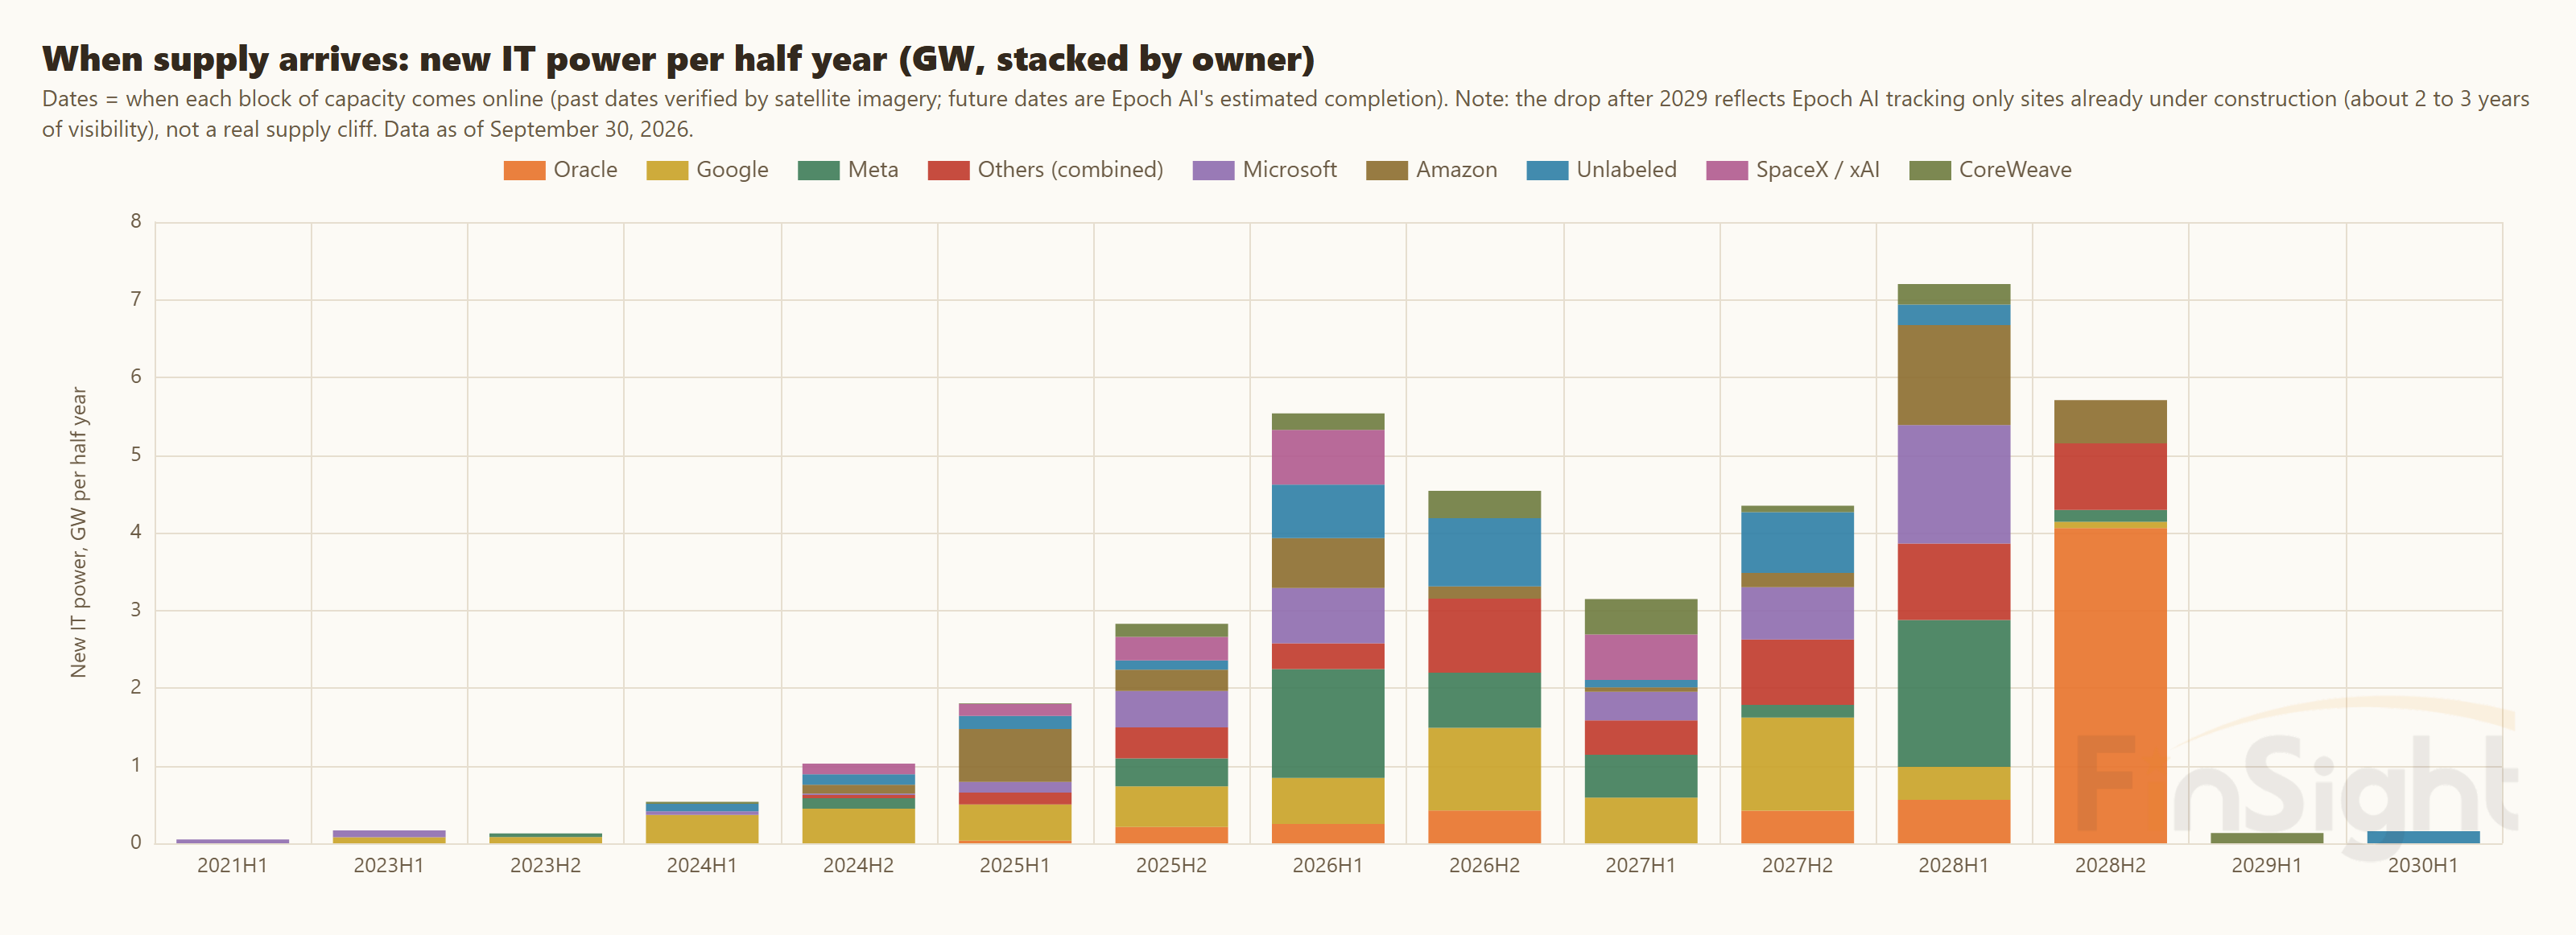
More data centers are coming, and demand also stepped up. Both moved higher, so the reason compute keeps getting tighter has changed since July.
In July, about half of the tightness came from too few data centers being built. Now demand is running ahead. To us, that is actually a sturdier footing. Tightness that rests on a data center shortage loosens in 2028, when the big wave of capacity opens. Tightness that rests on demand comes down to whether what customers pay keeps stepping up.
Rents tell the same story. The Silicon Data H100 rental index (SDH100RT) was $2.72 per hour at the end of September, up 4.6% in a week. Nebius raised its H100 price from $2.95 per hour to $3.85 in May and to $4.50 in October, up about 50% in five months. CoreWeave also said contracts signed early in the third quarter were priced above those signed before the end of June. There are more data centers than we saw in July, and rents are still rising. Demand is outrunning supply.
Station 3, cloud revenue catches up: the sellers say payback keeps getting faster
Station 2 asks whether what AI companies pay is enough for the chips to pay back. Station 3 looks at the side collecting the money: is cloud revenue keeping up?
The evidence here is the payback periods the sellers themselves cite, which keep getting shorter, from under three years to under two to under one:
- Late July, Amazon CEO Andy Jassy, on the 2Q26 earnings call: servers pay back in under three years on average and can stay in use for five to six years.
- Early September, Google Cloud CEO Thomas Kurian: AI servers overall pay back in under two years, and Google's own TPUs in about one.
- Early August, SpaceX (xAI is now part of SpaceX): new compute pays back in under a year. In late August, Nvidia CEO Jensen Huang also said he has heard of $50B-class data centers paying back in under a year.
These are all sellers of compute talking their own book, so take them with a grain of salt. That is why at Station 2 we built our own number that doesn't rely on the companies: revenue per chip. Both now point the same way. Payback really is getting faster.
With payback this fast, everyone wants to install more.
Last quarter, all four hyperscalers (Microsoft, Alphabet, Amazon, Meta) said they would stay capacity-constrained until after the end of 2027. This quarter brought more: Nebius's second price hike, CoreWeave's contracted power rising from 3.7GW to 4.2GW, along with more than $25B in new customer commitments it signed early in the third quarter. Prices are rising in a sold-out market, and capacity still sells out after the hikes. The late-October earnings season is the key test for Station 3.
The number to watch is public cloud growth. The capex going out now has to be depreciated every year from here on. To carry that, public cloud revenue needs to grow at least 53% to 55% year over year in 2027. We call that line the hurdle rate. Last quarter the three public clouds (AWS, Azure, Google Cloud) grew 48% combined. This quarter, we watch whether that moves closer to the hurdle rate.
Station 4 (whether cloud companies' cash keeps up with their spending) and Station 5 (whether anything is left after spending) will have to wait for 2027 and 2028 numbers.
AI compute script update: breakeven could come by year-end, two quarters earlier than our July call
Plug the numbers above back into the July method, and the script we laid out earlier needs an update:
- First, the threshold. More data centers mean more chips to carry, so the revenue threshold for the breakeven line rises too. But the extra capacity opening in the first half of 2027 mainly raises next year's threshold: for mid-2027 it goes from the $234B we wrote in July to $259B. The year-end 2026 chip count barely changed, so the year-end threshold only edges up, from $191B in July to a range of $196B to $199B now. That means if the five companies reach $196B to $199B in annualized revenue by year-end, newly built data centers break even. At $244B to $247B, they reach the expansion sweet spot.
- Next, year-end revenue. After its step up, OpenAI should go back to growing 8% to 12% a month, based on past experience, which gets it to about $95B by year-end. For Anthropic we conservatively use $100B. The other three stay at $7B combined. That adds up to about $202B, just over the $196B to $199B threshold, or about $4,600 per chip, a bit above the $4,500 breakeven line. If Anthropic keeps growing at its May-to-July pace (about 14% a month), it reaches $120B by year-end and the five companies reach $222B: comfortably over the line, but still well short of the $244B expansion sweet spot.
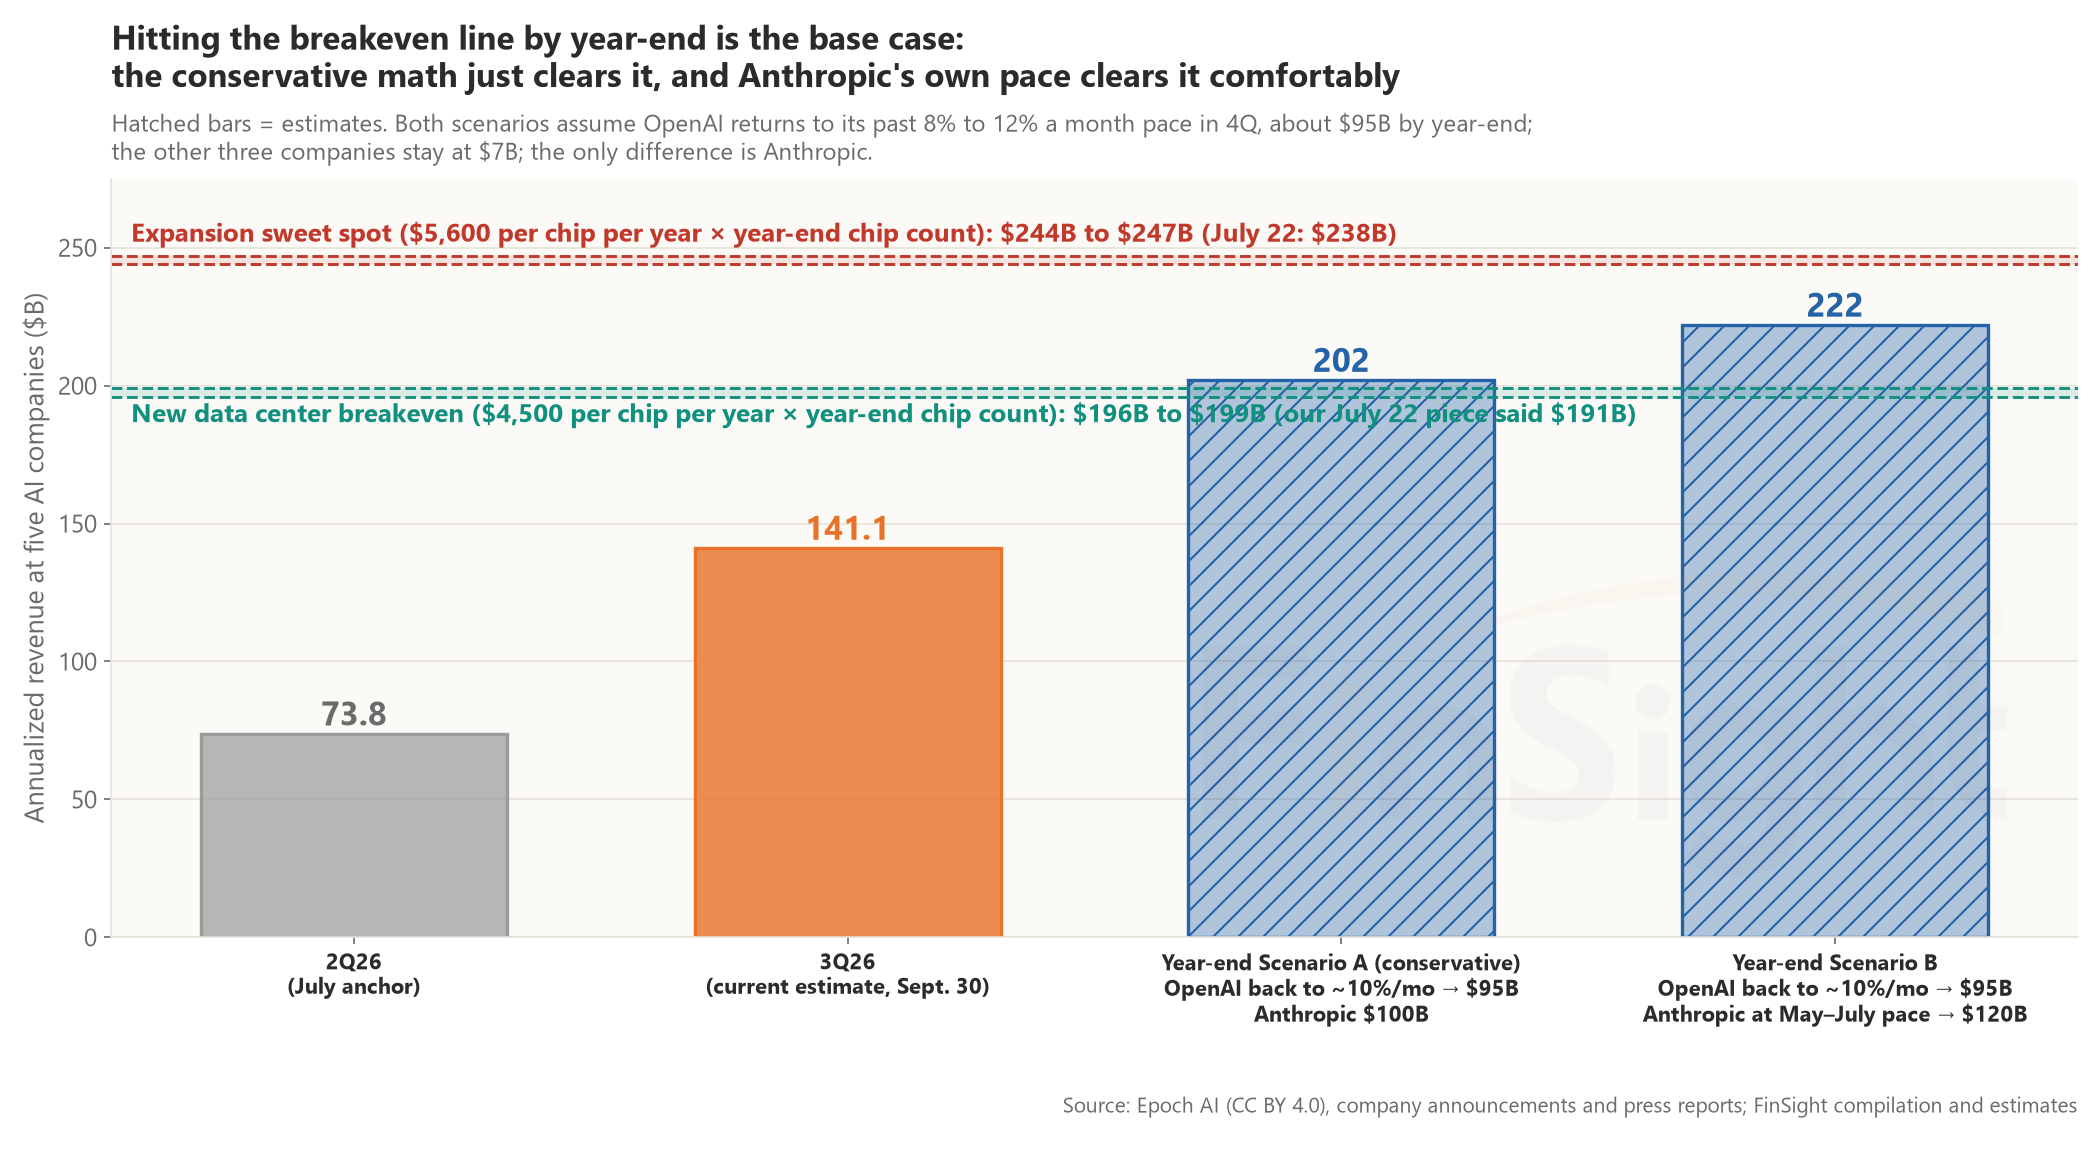
So here is the updated script: revenue per chip could reach the breakeven line by year-end, two quarters earlier than the mid-2027 we said in July. The expansion sweet spot ($5,600 per chip), which the July path put in 2028, could now come in the first half of 2027. Reaching it by mid-2027 takes roughly $320B in annualized revenue (the $259B mid-2027 breakeven threshold scaled up to $5,600 per chip), so the step-ups have to keep coming. We get two chances to check this number: Anthropic's IPO prospectus in November, which will replace our $100B floor with an audited figure, and the year-end numbers the companies announce in January 2027, which will show whether they really cleared the line.
What to watch next quarter
| Station | What we watch this quarter | The virtuous cycle would show | The vicious cycle would show |
|---|---|---|---|
| Station 1: Real customers are paying | Whether AI spend at the top 1% of companies rebounds in Ramp's September data; the audited numbers in Anthropic's IPO prospectus | The top 1% rebounds and the companies in the middle follow; Anthropic's number is above $100B | The top 1% falls for a second straight month; the audited number is far below $100B |
| Station 2: Each chip earns more (supply can't keep up) | Year-end annualized revenue at the five companies against the $196B to $199B threshold; whether revenue per chip changes once Epoch AI's 3Q chip shipment data is complete; GPU rents | Revenue clears the threshold by year-end; rents hold | Revenue misses the threshold by year-end; revenue per chip turns down; rents soften |
| Station 3: Cloud revenue catches up | The four hyperscalers' earnings calls: how long they say they will stay capacity-constrained; the three public clouds' growth against the 53% to 55% hurdle rate; 2027 capex guidance | Capacity-constrained until after the end of 2027; growth moves toward the hurdle rate; capex guidance keeps rising | Any one of them says supply has caught up; growth falls further below the hurdle rate two quarters in a row |
| Station 4: Operating cash flow keeps up with spending | How much the four hyperscalers' 2027 operating cash flow and capex each grow | Both grow about 40% | Capex grows faster than operating cash flow for two or more quarters in a row |
| Station 5: Free cash flow turns positive | This is a 2028 question; this quarter we only watch for changes in buybacks and bond issuance | Bond issuance settles into a regular cadence; order books stay well oversubscribed | Order book coverage drops below 2.5x; credit ratings get cut |
We check each report from mid-October through the end of November, company by company, against what the virtuous cycle and the vicious cycle would each look like.
Source: FinSight AI Buildout Scorecard, October 2026
What would change our view
- Anthropic misses $100B by year-end. If it ends the year near the $65B it last announced, the five companies stall around $170B, more than 10% short of the threshold, and hitting the line slips to the first or second quarter of 2027. We will know as soon as the numbers in the November IPO prospectus come out.
- Supply gets revised up faster than demand. More supply raises the threshold. If Epoch AI's 3Q chip data, once complete, shows more chips than we estimated, or if data center timelines keep getting revised up while rents fall, revenue per chip gets pulled down. Then we would watch three things together: chipmakers' guidance next quarter, Epoch AI's weekly data center timeline updates, and rents.
- The August drop in spending at the top 1% of companies turns out to be more than summer. The heaviest users move first, and revenue shows it last. If the top 1% keeps falling in September and October, this step up is fading, and the next step up in revenue won't come.
Closing thoughts
When we came back to writing about AI in mid-July, the market was full of doubt: revenue has topped out, capex will never pay back, AI will eat software, the debt will blow up. What we wanted to do then was simple: lay the numbers out, take each worry apart on its own terms, and give readers a different set of views, data and tools to work with. Three months on, we have written eleven pieces and launched our research tools one by one. Looking back, they add up to this Scorecard.
All the research and writing over these three months, from pulling data, calculating thresholds and drawing charts to editing drafts and updating the site, I did with AI working alongside me. The main tools were Anthropic's Claude (the Fable model) and OpenAI's Astra (launched in September). One person only has so much time, and a lot of what I wanted to do but could never finish is now actually getting done. We keep writing about whether AI can earn back what it spends. These articles themselves are probably the closest answer I have.
The Scorecard going live is not a conclusion. It is a starting point.
From here on, we will check every quarter's earnings and every month's data against this Scorecard. When a light turns on or goes off, we will tell you. If the script plays out, we will say so, and if it goes wrong, we will say that too. These months of research have set a lot of benchmarks to test against. From here, we test them one step at a time and adjust as the data comes in.
Before earnings season starts, we will finish writing up the remaining pieces of the Scorecard. Thank you to everyone who has followed our work along the way. Your support and encouragement are what keep me moving forward.